Table of Contents
Historic trends in telecommunications performance
Published 07 February, 2020; last updated 10 December, 2020
There do not appear to have been any greater than 10-year discontinuities in telecommunications performance, measured as:
- bandwidth-distance product for all technologies 1840-2015
- bandwidth-distance product for optical fiber 1975-2000
- total bandwidth across the Atlantic 1956-2018
Radio does not seem likely to have represented a discontinuity in message speed.
Details
This case study is part of AI Impacts’ discontinuous progress investigation.
Background
Fiber optic cables were first used for telecommunications in the 1970s and 80s.1 While previous telecommunications technology sent information via electricity, fiber optic cables instead sent information via light. Though electric signals travel at around 80% of the speed of light, while optical signals within a fiber only travel at roughly 70% of the speed of light, fiber optics have other benefits which add up to a considerable advantage.2
Trends
Bandwidth-distance product, usually given in bits*kilometers/seconds, is both the most apparently relevant metric of progress in telecommunications4 5, and the one that was suggested to us as discontinuous. We also considered data transfer rate (measured in Mbps) for transatlantic cables, as a metric which more closely tracks the performance of cables that were actually in use, with the Atlantic serving as a distance constraint. We found separate data for bandwidth-distance product across all technologies, in fiber optics alone, and crossing the Atlantic, so we consider each of these metrics.
Bandwidth-distance product across all technologies 1840-2015
Data
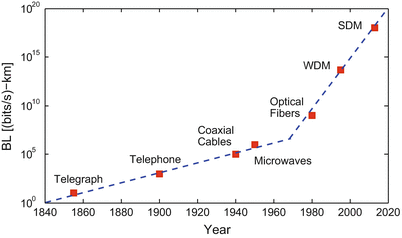
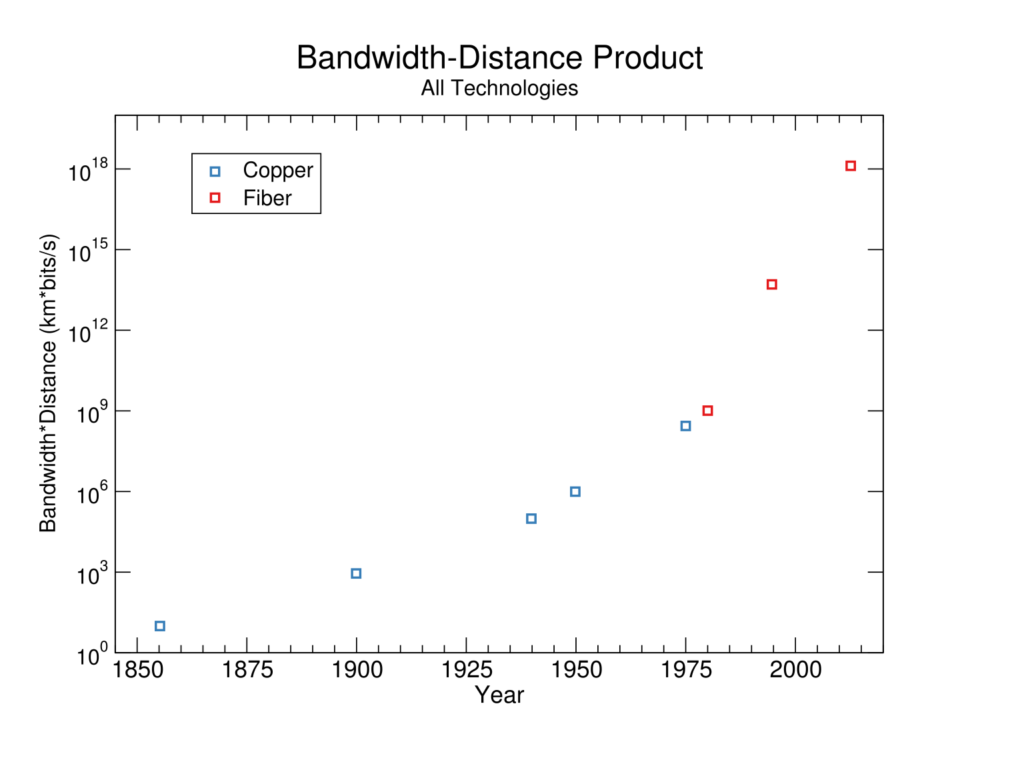
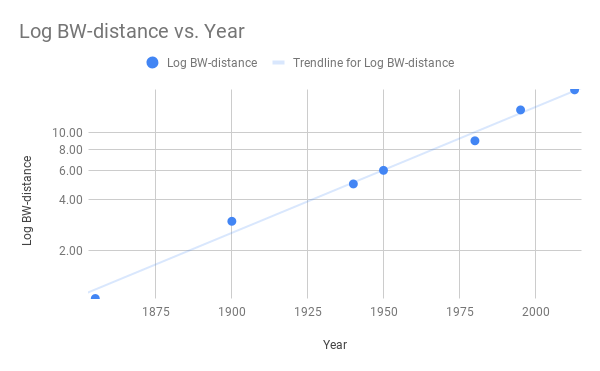
We used a tool for extracting data from figures6 to extract data from Figure 8.2 from Agrawal, 2016,7 shown in Figure 1. We put the data into this spreadsheet. Figures 2 and 3 show this data without a trendline, and the log of the data on a log axis with a straight trendline.
Figure 1 below shows progress in bandwidth-distance product across all technologies on a log scale.
Discontinuity measurement
If we treat the previous rate of progress at each point to be exponential (as Agrawal does, with two different regimes) then optical fibers appear to represent a 27 year discontinuity.8 The following 2-3 developments are also substantial discontinuities, depending on whether one breaks the data into multiple trends. As shown in Figure 3 however, the log of the data fits an exponential trend well. If we extrapolate progress expecting the log to be exponential, there are no discontinuities of more than ten years in this data. This seems like the better fit, so we take it there are not discontinuities.
Argawal’s data also does not include minor improvements on the broad types of systems mentioned, which presumably occurred. In particular, our impression is that there were better coaxial cables as well as worse optical fibers, such that the difference when fiber optics appeared was probably not more than a factor of two,9 10 or about six years of exponential progress at the rate seemingly prevailing around the time of coaxial cables.11
Bandwidth-distance product in fiber optics alone 1975-2000
Data
We used a tool for extracting data from figures to extract data from Figure 8.8 from Agrawal, 201612 and put it into this spreadsheet.
Figure 4 below shows bandwidth-distance product on a log scale in fiber optics alone, from Agrawal, 2016.
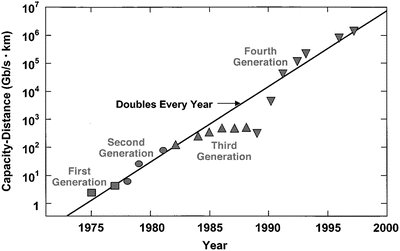
Progress in bandwidth-distance product in fiber optics alone, from Agrawal, 2016 (Note: 1 Gb = 10^9 bits)
Discontinuity measurement
We chose to model this data as a single exponential trend.13 Compared to previous rates in this trend, there are no greater than ten year discontinuities in bandwidth-distance product in fiber optics alone.14
Bandwidth for Transatlantic Cables 1956-2018
Data
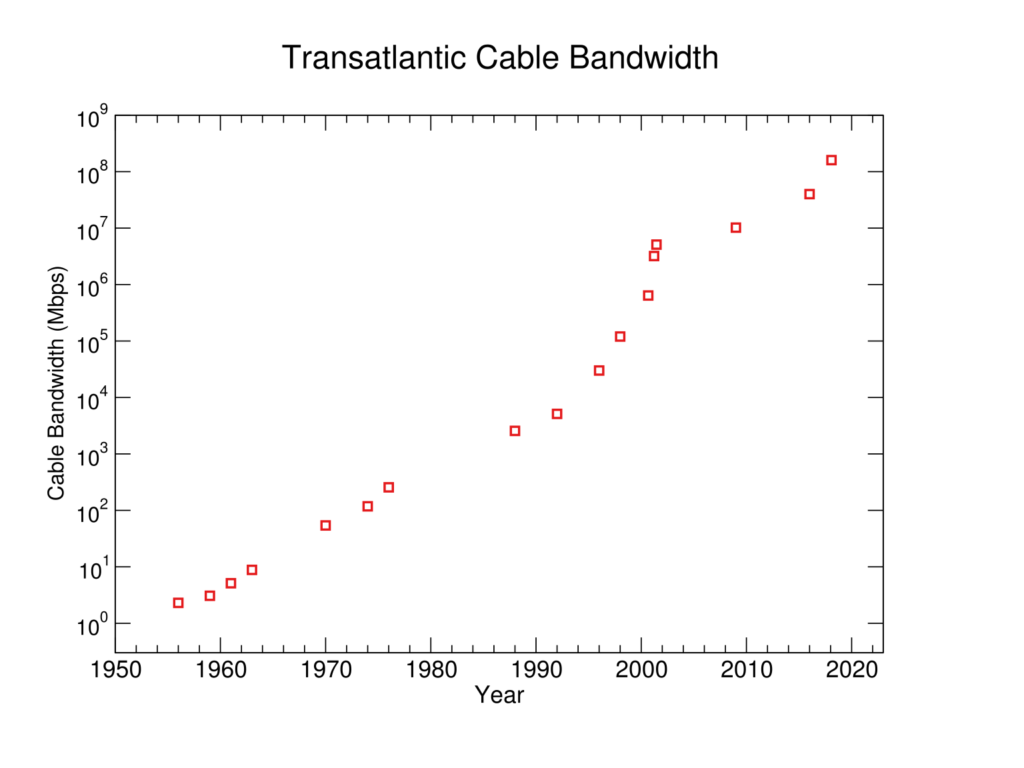
Figure 5 shows bandwidth of transatlantic cables according to our own calculations, based on data we collected mainly from Wikipedia.15
Discontinuity measurement
We treat this data as a single exponential trend.16 The data did not contain any discontinuities of more than ten years.18
There was a notable temporary increase in the growth rate between 1996 and 2001. We speculate that this and the following 15 years of stagnation may be a result of heavy telecommunications investment during the dot com bubble.19
Notes
- “If the attenuation could be lowered sufficiently, they theorized fiber optics could be used as a practical means of communication. The attenuation barrier was broken in 1970 … Within two decades, innovative research pushed the attenuation rate low enough for fiber optics to become the dominant carrier of electronic information.”
“History.” Fiber Optic Cable History – Fiber Optic Cables for the Telecommunications, Defense and Broadcast TV Industries – Tevelec Limited. Accessed April 19, 2019. https://www.tevelec.com/history. - “Good cables achieve 80% of the speed of light; excellent cables achieve 90%.” “Speed of Light vs Speed of Electricity.” Physics Stack Exchange. Accessed April 19, 2019. https://physics.stackexchange.com/questions/358894/speed-of-light-vs-speed-of-electricity. For a summary of the many advantages fiber optics have over electric cables for communication, see
https://en.wikipedia.org/wiki/Optical_fiber#Uses - “Because the effect of dispersion increases with the length of the fiber, a fiber transmission system is often characterized by its bandwidth–distance product, usually expressed in units of MHz·km. This value is a product of bandwidth and distance because there is a trade-off between the bandwidth of the signal and the distance over which it can be carried. ”
“Fiber-optic Communication.” Wikipedia. June 23, 2019. Accessed July 03, 2019. https://en.wikipedia.org/wiki/Fiber-optic_communication#Bandwidth–distance_product. - “The term bandwidth–distance product (or bandwidth–length product) is often used in the context of optical fiber communications. … The concept of the bandwidth–distance product is helpful e.g. for comparing the performance of different types of fiber-optic links.” Paschotta, Rüdiger. “Bandwidth–distance Product.” RP Photonics Encyclopedia – Bandwidth-distance Product, Bandwidth-length Product. May 29, 2019. Accessed July 03, 2019. https://www.rp-photonics.com/bandwidth_distance_product.html.
- Agrawal, Govind P. 2016. “Optical Communication: Its History And Recent Progress”. Optics In Our Time, 177-199. Springer International Publishing. doi:10.1007/978-3-319-31903-2_8., https://link.springer.com/chapter/10.1007/978-3-319-31903-2_8
- See this spreadsheet for all calculations
- From Wikipedia: “After a period of research starting from 1975, the first commercial fiber-optic communications system was developed which operated at a wavelength around 0.8 µm and used GaAs semiconductor lasers. This first-generation system operated at a bit rate of 45 Mbit/s with repeater spacing of up to 10 km.” “Fiber-optic Communication.” Wikipedia. June 23, 2019. Accessed July 03, 2019. https://en.wikipedia.org/wiki/Fiber-optic_communication#History.
- We think the most advanced coaxial system in place at the time operated at around 2.7×108 bits*km/s. From Optics In Our Time: “The most advanced coaxial system was put into service in 1975 and operated at a bit rate of 274 Mbit/s. A severe drawback of high-speed coaxial systems was their small repeater spacing (∼∼ 1 km)” Agrawal, Govind P. 2016. “Optical Communication: Its History And Recent Progress”. Optics In Our Time, 177-199. Springer International Publishing. doi:10.1007/978-3-319-31903-2_8.
- According to Argawal’s figure, the metric improved by around a factor of 1.11 each year (see spreadsheet)
- See our methodology page for more details.
- See our methodology page for more details.
- e.g. “During the late 1990s there was tremendous investment and entry of new firms in the North American long-haul telecommunications industry. These expansions were driven by very fast demand growth for Internet and other data-oriented telecom services and by exponential decreases in the cost per bit transmitted using fiber optic communications equipment. But by 2001, competition and slowing demand growth were squeezing the profits of these carriers, and an equally unprecedented slowdown in spending occurred. The problems in the telecommunications sector were blamed for slowing growth in the entire U.S. economy. As the expansion turned to bust, discussion of ‘‘excessive entry’’ and a ‘‘fiber glut’’ became increasingly common.” Hogendorn, Christiaan. “Excessive(?) Entry of National Telecom Networks, 1990-2001.” SSRN Electronic Journal, 2004. doi:10.2139/ssrn.584821.

