Table of Contents
Historic trends in land speed records
Published 17 July, 2019; last updated 23 April, 2020
Land speed records did not see any greater-than-10-year discontinuities relative to linear progress across all records. Considered as several distinct linear trends it saw discontinuities of 12, 13, 25, and 13 years, the first two corresponding to early (but not first) jet-propelled vehicles.
The first jet-propelled vehicle just predated a marked change in the rate of progress of land speed records, from a recent 1.8 mph / year to 164 mph / year.
Details
This case study is part of AI Impacts’ discontinuous progress investigation.
Background
According to Wikipedia, the land speed record is “the highest speed achieved by a person using a vehicle on land.”1 Wheel-driven cars, which supply power to their axles, held the records for land speed record through 1963, when the first turbojet powered vehicles arrived on the scene. No wheel-driven car has held the record since 1964.2
Trends
Land speed records
Data
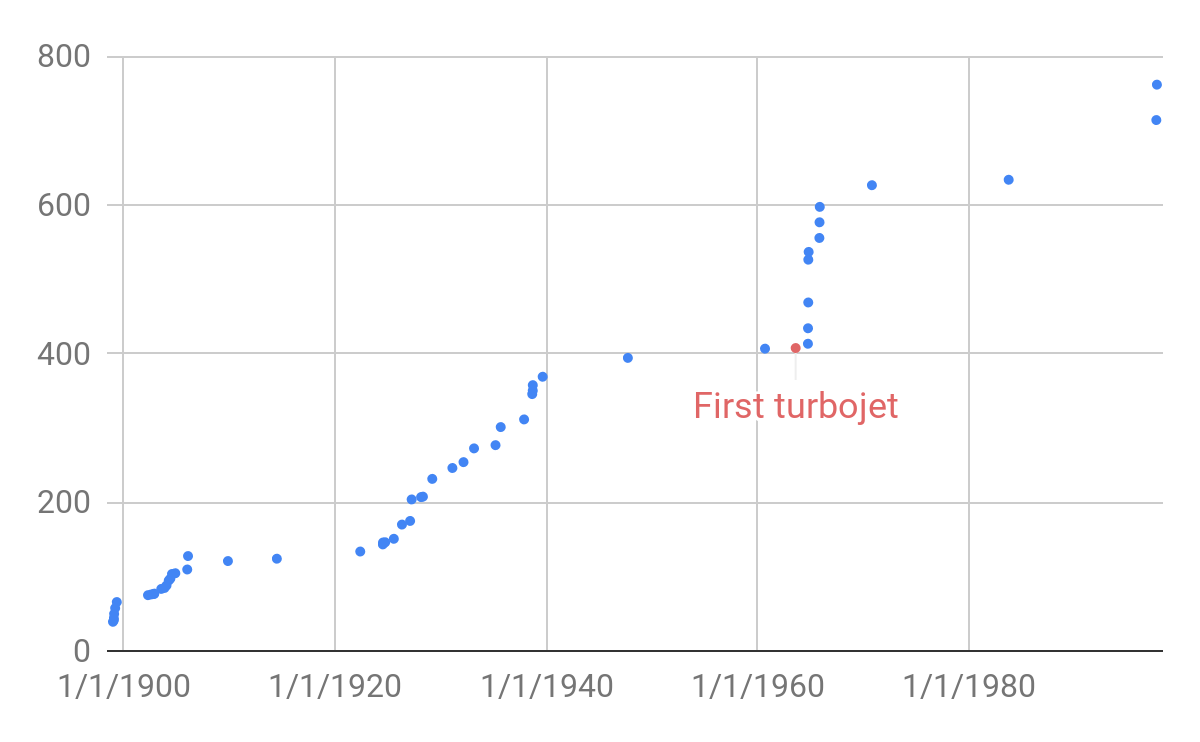
We took data from Wikipedia’s list of land speed records,4 which we have not verified, and added it to this spreadsheet. See Figure 2 below.
Discontinuity measurement
If we treat the data as a linear trend across all time,5 then the land speed record did not contain any greater than 10-year discontinuities.
However we divide the data into several linear trends.6 Extrapolating based on these trends, there were four discontinuities of sizes 12, 13, 25, and 13 years, produced by different turbojet-powered vehicles.7In addition to the size of these discontinuities in years, we have tabulated a number of other potentially relevant metrics here.8
Changes in the rate of progress
There are several marked changes in the rate of progress in this history. The first two discontinuities are near the start of a sharp change, that seemed to come from the introduction of jet-propulsion (though note that the first jet-propelled vehicle in the trend is neither discontinuous with the previous trend, nor seemingly within the period of faster growth).
If we look at the rates of progress in the stretches directly before the second jet propelled vehicle in 1964, and the stretch directly after that through 1965, the rate of progress increases from 1.8 mph / year to 164 mph / year.9
Notes
- “Craig Breedlove’s mark of 407.447 miles per hour (655.722 km/h), set in Spirit of America in September 1963, was initially considered unofficial. The vehicle breached the FIA regulations on two grounds: it had only three wheels, and it was not wheel-driven, since its jet engine did not supply power to its axles. […] The confusion of having three different LSRs lasted until December 11, 1964, when the FIA and FIM met in Paris and agreed to recognize as an absolute LSR the higher speed recorded by either body, by any vehicles running on wheels, whether wheel-driven or not. […] No wheel-driven car has since held the absolute record.” – “Land Speed Record”. 2019. En.Wikipedia.Org. Accessed May 25 2019. https://en.wikipedia.org/wiki/Land_speed_record.
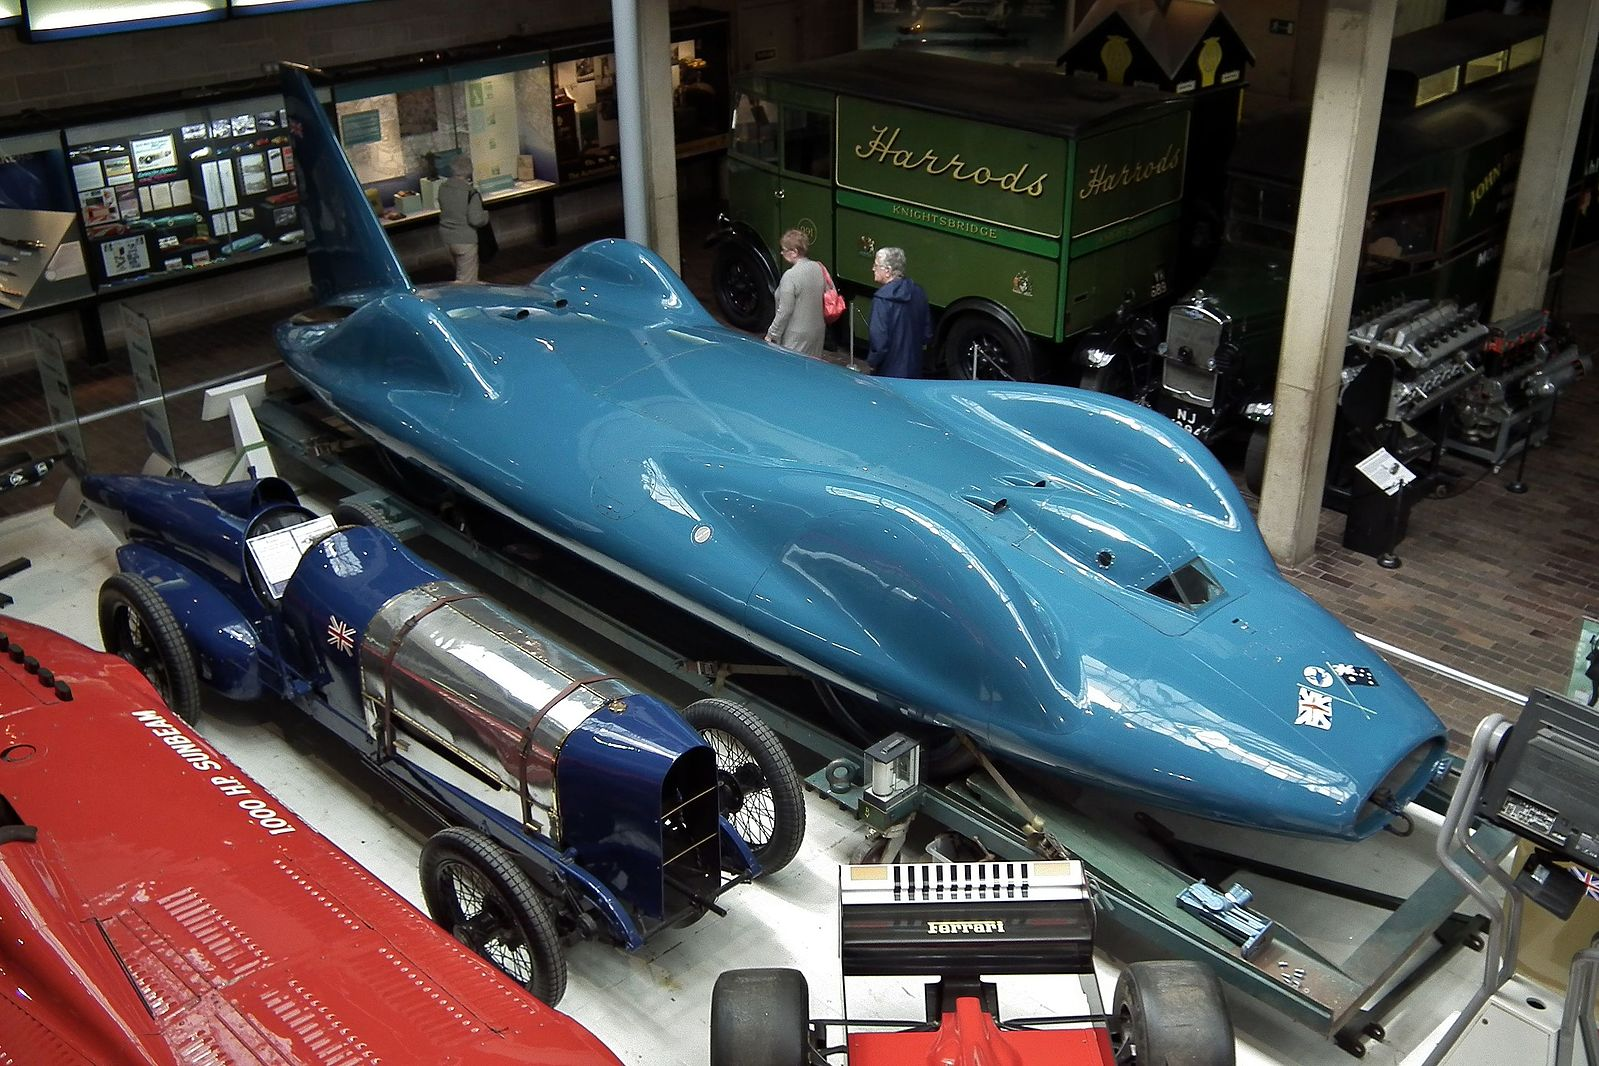
- From Wikimedia Commons: sv1ambo [CC BY 2.0 (https://creativecommons.org/licenses/by/2.0)]
- See our our methodology page for more details.
- See our spreadsheet to view the trends, and our methodology page for details on how to interpet our sheets and when and how we divide data into trends.
- See our methodology page for more details.
.jpg)
