Table of Contents
Historic trends in particle accelerator performance
Published 26 March, 2019; last updated 08 March, 2021
None of particle energy, center-of-mass energy nor Lorentz factor achievable by particle accelerators appears to have undergone a discontinuity of more than ten years of progress at previous rates.
Details
This case study is part of AI Impacts’ discontinuous progress investigation.
Background
Particle accelerators propel charged particles at high speeds, typically so that experiments can be conducted on them.1

Trends
Our understanding is that key performance metrics for particle accelerators include how much kinetic energy they can generate in particles, how much center-of-mass energy they can create in collisions between particles, and the Lorentz factor they can achieve.
‘Livingston charts’ show progress in particle accelerator efficacy over time, and seem to be common. We took data from a relatively recent and populated one in a slide deck from a Cornell accelerator physics course (see slide 45),3 and extracted data from it, shown in this spreadsheet (see columns ‘year’ and ‘eV’ in tabs ‘Hoffstaetter Hadrons’ and ‘Hoffstaetter Leptons’ for original data).
The standard performance metric in a Livingston chart is ‘energy needed for a particle to hit a stationary proton with the same center of mass energy as the actual collisions in the accelerator’. We are uncertain why this metric is used, though it does allow for comparisons to earlier technology in a way that CM energy does not. We used a Lorentz transform to obtain particle energy, center-of-mass energy, and Lorentz factors from the Livingston chart data.4
Particle energy
Data
Figure 1 shows our data on particle energy over time, also available in our spreadsheet, tab ‘Particle energy’.
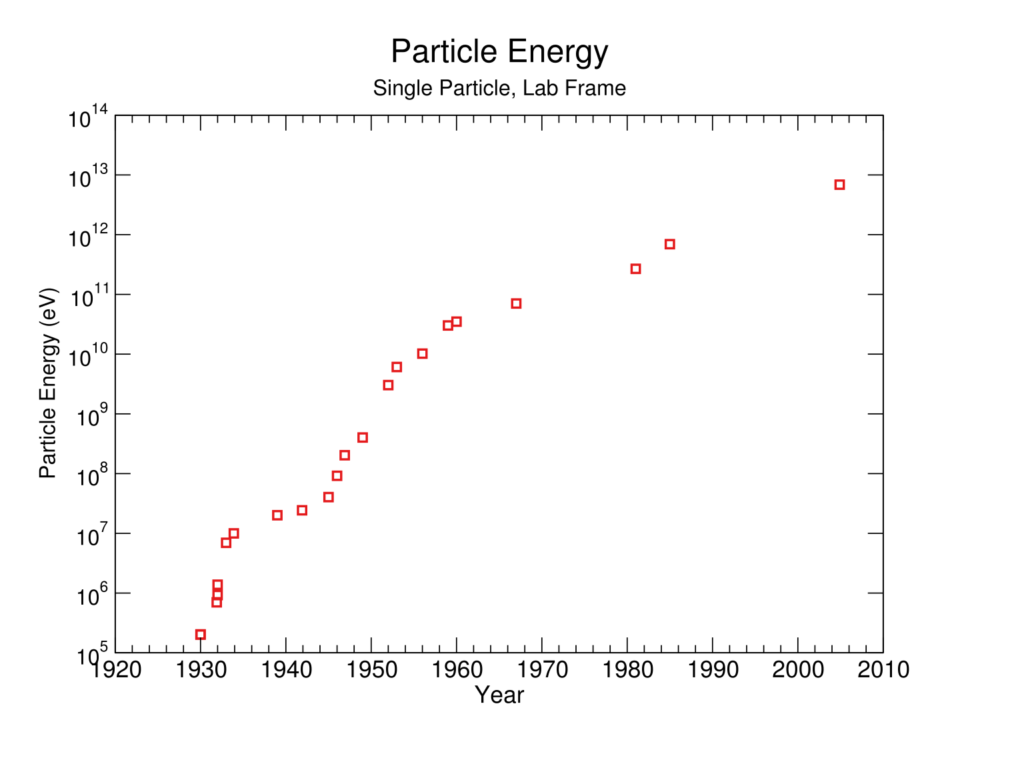
Discontinuity measurement
We chose to model the data as a single exponential trend.5 There are no greater than 10-year discontinuities in particle energy at previous rates within this trend.6
Center-of-mass energy
Data
Figure 2 shows our data on center-of-mass energy over time, also available in this spreadsheet, tab ‘CM energy’.
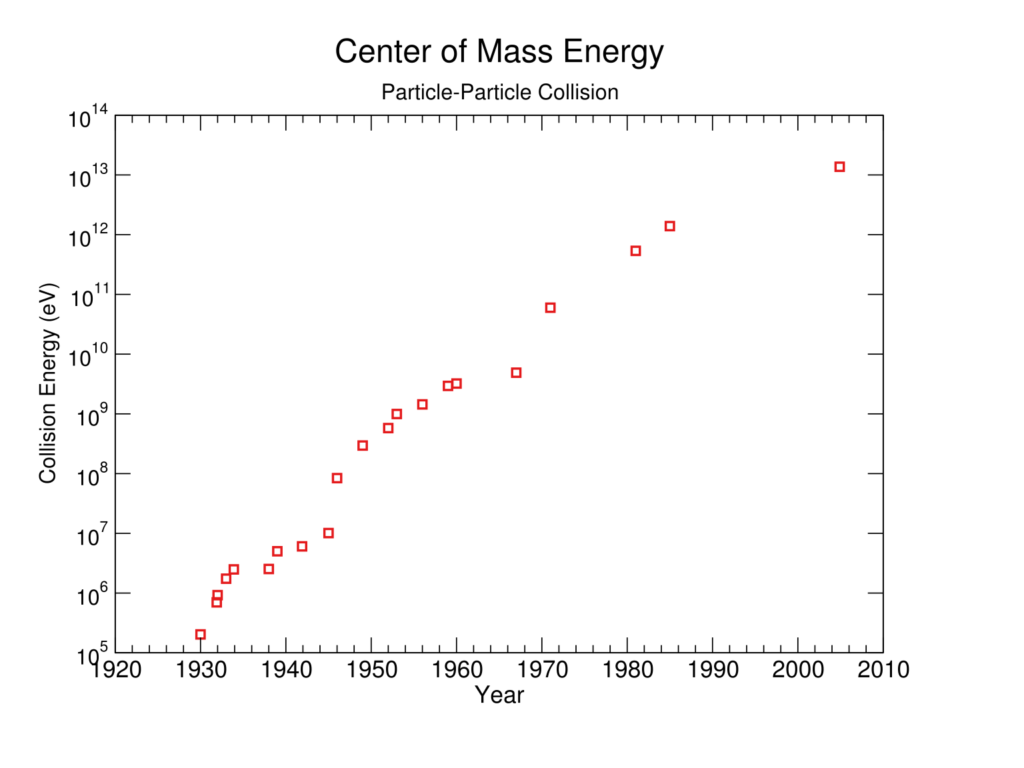
Discontinuity measurement
We treated the data as exponential.7 There are no greater than 10-year discontinuities in center-of-mass energy at previous rates within this trend.8
Lorentz factor
According to Wikipedia, ‘The Lorentz factor or Lorentz term is the factor by which time, length, and relativistic mass change for an object while that object is moving.’
Data
This spreadsheet, tab ‘Lorentz factor’, shows our calculated data for progress on Lorentz factors attained over time.
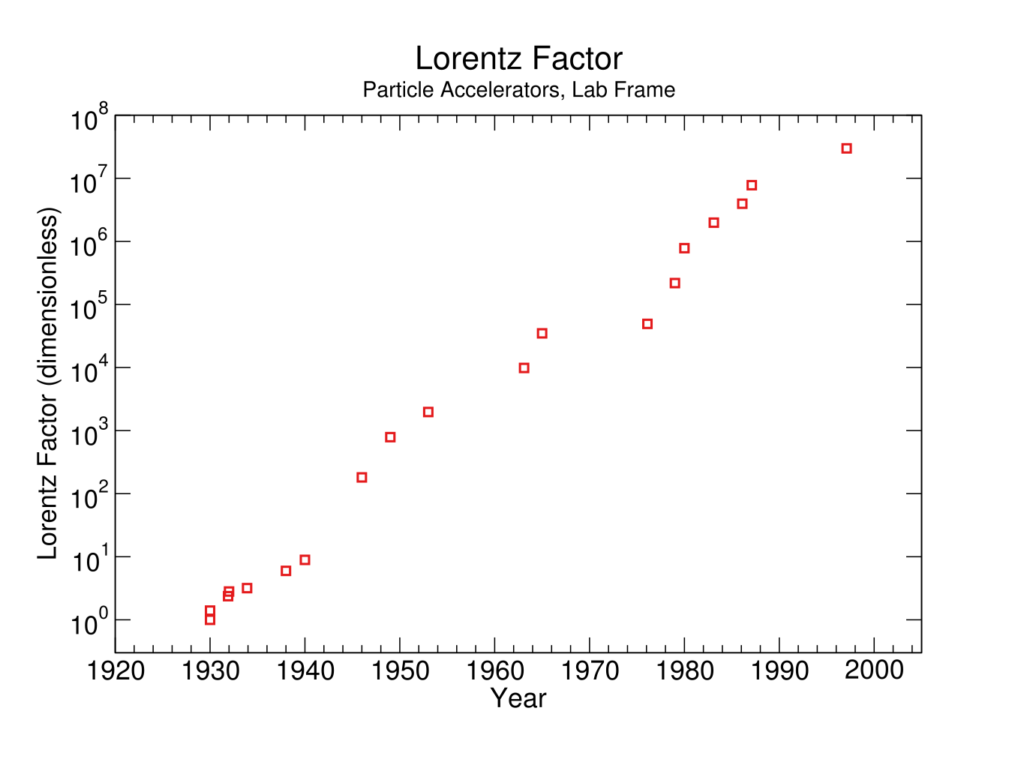
Discontinuity measurement
We treated the data as one exponential trend.9 There were no greater than 10-year discontinuities at previous rates within this trend.10
Primary author: Rick Korzekwa
Notes
- “A particle accelerator is a machine that uses electromagnetic fields to propel charged particles to very high speeds and energies, and to contain them in well-defined beams. Large accelerators are used for basic research in particle physics.” – “Particle Accelerator”. 2019. En.Wikipedia.Org. Accessed June 30 2019. https://en.wikipedia.org/w/index.php?title=Particle_accelerator&oldid=903597299.
- A Lorentz transform allows us to recalculate velocities with a changed frame of reference, taking into account special relativity, which is a material consideration for such fast-moving objects.
See Rick Korzekwa’s explanation of his calculation of this here: https://docs.google.com/document/d/1Nv-0Jg6lMNobcDbfuruLwA8hYCXiPvq32f3NHz0BCLs/edit?usp=sharing
- See our methodology page for more details.
- See our methodology page for more details, and our spreadsheet, tab ‘Particle energy’ for our calculation of discontinuities.
- See our methodology page for more details.
- See our methodology page for more details, and this spreadsheet, tab ‘CM energy’ for our calculation of discontinuities.
- See our methodology page for more details.
- See our methodology page for more details, and our spreadsheet, tab ‘Lorentz factor’ for our calculation of discontinuities.
