Table of Contents
2019 recent trends in GPU price per FLOPS
Published 25 March, 2020; last updated 09 June, 2020
We estimate that in recent years, GPU prices have fallen at rates that would yield an order of magnitude over roughly:
- 17 years for single-precision FLOPS
- 10 years for half-precision FLOPS
- 5 years for half-precision fused multiply-add FLOPS
Details
GPUs (graphics processing units) are specialized electronic circuits originally used for computer graphics.1 In recent years, they have been popularly used for machine learning applications.2 One measure of GPU performance is FLOPS, the number of operations on floating-point numbers a GPU can perform in a second.3 This page looks at the trends in GPU price / FLOPS of theoretical peak performance over the past 13 years. It does not include the cost of operating the GPUs, and it does not consider GPUs rented through cloud computing.
Theoretical peak performance
‘Theoretical peak performance’ numbers appear to be determined by adding together the theoretical performances of the processing components of the GPU, which are calculated by multiplying the clock speed of the component by the number of instructions it can perform per cycle.4 These numbers are given by the developer and may not reflect actual performance on a given application.5
Metrics
We collected data on multiple slightly different measures of GPU price and FLOPS performance.
Price metrics
GPU prices are divided into release prices, which reflect the manufacturer suggested retail prices that GPUs are originally sold at, and active prices, which are the prices at which GPUs are actually sold at over time, often by resellers.
We expect that active prices better represent prices available to hardware users, but collect release prices also, as supporting evidence.
FLOPS performance metrics
Several varieties of ‘FLOPS’ can be distinguished based on the specifics of the operations they involve. Here we are interested in single-precision FLOPS, half-precision FLOPS, and half-precision fused-multiply add FLOPS.
‘Single-precision’ and ‘half-precision’ refer to the number of bits used to specify a floating point number.6 Using more bits to specify a number achieves greater precision at the cost of more computational steps per calculation. Our data suggests that GPUs have largely been improving in single-precision performance in recent decades,7 and half-precision performance appears to be increasingly popular because it is adequate for deep learning.8
Nvidia, the main provider of chips for machine learning applications,9 recently released a series of GPUs featuring Tensor Cores,10 which claim to deliver “groundbreaking AI performance”. Tensor Core performance is measured in FLOPS, but they perform exclusively certain kinds of floating-point operations known as fused multiply-adds (FMAs).11 Performance on these operations is important for certain kinds of deep learning performance,12 so we track ‘GPU price / FMA FLOPS’ as well as ‘GPU price / FLOPS’.
In addition to purely half-precision computations, Tensor Cores are capable of performing mixed-precision computations, where part of the computation is done in half-precision and part in single-precision.13 Since explicitly mixed-precision-optimized hardware is quite recent, we don’t look at the trend in mixed-precision price performance, and only look at the trend in half-precision price performance.
Precision tradeoffs
Any GPU that performs multiple kinds of computations (single-precision, half-precision, half-precision fused multiply add) trades off performance on one for performance on the other, because there is limited space on the chip, and transistors must be allocated to either one type of computation or the other.14 All current GPUs that perform half-precision or TensorCore fused-multiply-add computations also do single-precision computations, so they are splitting their transistor budget. For this reason, our impression is that half-precision FLOPS could be much cheaper now if entire GPUs were allocated to each one alone, rather than split between them.
Release date prices
We collected data on theoretical peak performance (FLOPS), release date, and price from several sources, including Wikipedia.15 (Data is available in this spreadsheet). We found GPUs by looking at Wikipedia’s existing large lists16 and by Googling “popular GPUs” and “popular deep learning GPUs”. We included any hardware that was labeled as a ‘GPU’. We adjusted prices for inflation based on the consumer price index.17
We were unable to find price and performance data for many popular GPUs and suspect that we are missing many from our list. In our search, we did not find any GPUs that beat our 2017 minimum of
GPU price / single-precision FLOPS
Figure 1 shows our collected dataset for GPU price / single-precision FLOPS over time.19
To find a clear trend for the prices of the cheapest GPUs / FLOPS, we looked at the running minimum prices every 10 days.20
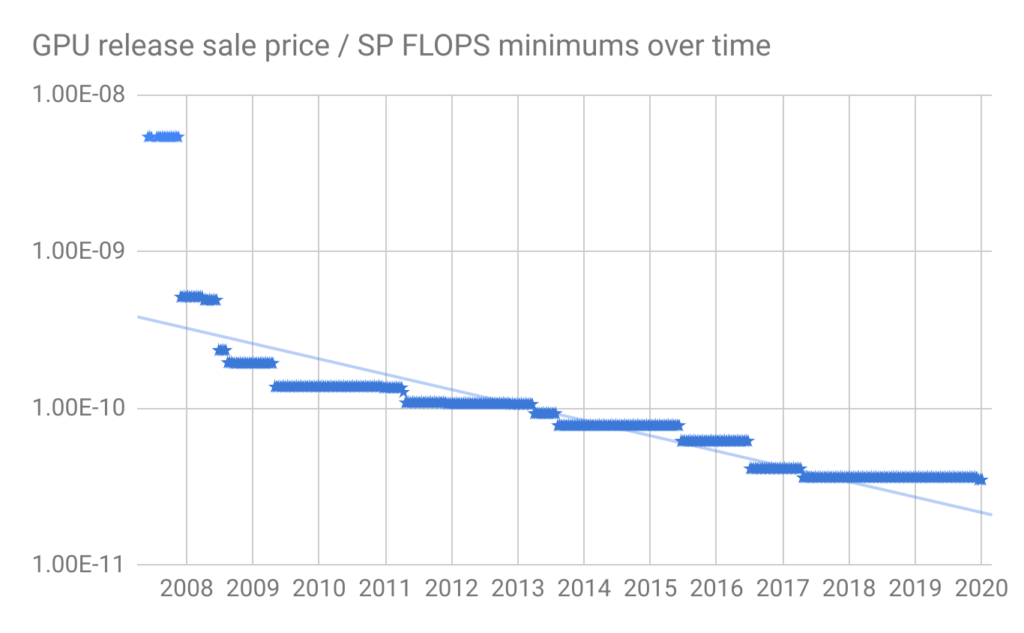
The cheapest GPU price / FLOPS hardware using release date pricing has not decreased since 2017. However there was a similar period of stagnation between early 2009 and 2011, so this may not represent a slowing of the trend in the long run.
Based on the figures above, the running minimums seem to follow a roughly exponential trend. If we do not include the initial point in 2007, (which we suspect is not in fact the cheapest hardware at the time), we get that the cheapest GPU price / single-precision FLOPS fell by around 17% per year, for a factor of ten in ~12.5 years.21
GPU price / half-precision FLOPS
Figure 3 shows GPU price / half-precision FLOPS for all the GPUs in our search above for which we could find half-precision theoretical performance.22
Again, we looked at the running minimums of this graph every 10 days, shown in Figure 4 below.23
If we assume an exponential trend with noise,24 cheapest GPU price / half-precision FLOPS fell by around 26% per year, which would yield a factor of ten after ~8 years.25
GPU price / half-precision FMA FLOPS
Figure 5 shows GPU price / half-precision FMA FLOPS for all the GPUs in our search above for which we could find half-precision FMA theoretical performance.26 (Note that this includes all of our half-precision data above, since those FLOPS could be used for fused-multiply adds in particular). GPUs with TensorCores are marked in red.
Figure 6 shows the running minimums of GPU price / HP FMA FLOPS.27
GPU price / Half-Precision FMA FLOPS appears to be following an exponential trend over the last four years, falling by around 46% per year, for a factor of ten in ~4 years.28
Active Prices
GPU prices often go down from the time of release, and some popular GPUs are older ones that have gone down in price.29 Given this, it makes sense to look at active price data for the same GPU over time.
Data Sources
We collected data on peak theoretical performance in FLOPS from TechPowerUp30 and combined it with active GPU price data to get GPU price / FLOPS over time.31 Our primary source of historical pricing data was Passmark, though we also found a less trustworthy dataset on Kaggle which we used to check our analysis. We adjusted prices for inflation based on the consumer price index.32
Passmark
We scraped pricing data33 on GPUs between 2011 and early 2020 from Passmark.34 Where necessary, we renamed GPUs from Passmark to be consistent with TechPowerUp.35 The Passmark data consists of 38,138 price points for 352 GPUs. We guess that these represent most popular GPUs.
Looking at the ‘current prices’ listed on individual Passmark GPU pages, prices appear to be sourced from Amazon, Newegg, and Ebay. Passmark’s listed pricing data does not correspond to regular intervals. We don’t know if prices were pulled at irregular intervals, or if Passmark pulls prices regularly and then only lists major changes as price points. When we see a price point, we treat it as though the GPU is that price only at that time point, not indefinitely into the future.
The data contains several blips where a GPU is briefly sold very unusually cheaply. A random checking of some of these suggests to us that these correspond to single or small numbers of GPUs for sale, which we are not interested in tracking, because we are trying to predict AI progress, which presumably isn’t influenced by temporary discounts on tiny batches of GPUs.
Kaggle
This Kaggle dataset contains scraped data of GPU prices from price comparison sites PriceSpy.co.uk, PCPartPicker.com, Geizhals.eu from the years 2013 – 2018. The Kaggle dataset has 319,147 price points for 284 GPUs. Unfortunately, at least some of the data is clearly wrong, potentially because price comparison sites include pricing data from untrustworthy merchants.36 As such, we don’t use the Kaggle data directly in our analysis, but do use it as a check on our Passmark data. The data that we get from Passmark roughly appears to be a subset of the Kaggle data from 2013 – 2018,37 which is what we would expect if the price comparison engines picked up prices from the merchants Passmark looks at.
Limitations
There are a number of reasons why we think this analysis may in fact not reflect GPU price trends:
- We effectively have just one source of pricing data, Passmark.
- Passmark appears to only look at Amazon, Newegg, and Ebay for pricing data.
- We are not sure, but we suspect that Passmark only looks at the U.S. versions of Amazon, Newegg, and Ebay, and pricing may be significantly different in other parts of the world (though we guess it wouldn’t be different enough to change the general trend much).
- As mentioned above, we are not sure if Passmark pulls price data regularly and only lists major price changes, or pulls price data irregularly. If the former is true, our data may be overrepresenting periods where the price changes dramatically.
- None of the price data we found includes quantities of GPUs which were available at that price, which means some prices may be for only a very limited number of GPUs.
- We don’t know how much the prices from these datasets reflect the prices that a company pays when buying GPUs in bulk, which we may be more interested in tracking.
A better version of this analysis might start with more complete data from price comparison engines (along the lines of the Kaggle dataset) and then filter out clearly erroneous pricing information in some principled way.
Data
The original scraped datasets with cards renamed to match TechPowerUp can be found here. GPU price / FLOPS data is graphed on a log scale in the figures below. Price points for the same GPU are marked in the same color. We adjusted prices for inflation using the consumer price index.38 All points below are in 2019 dollars.
To try to filter out noisy prices that didn’t last or were only available in small numbers, we took out the lowest 5% of data in every several day period39 to get the 95th percentile cheapest hardware. We then found linear and exponential trendlines of best fit through the available hardware with the lowest GPU price / FLOPS every several days.40
GPU price / single-precision FLOPS
Figures 7-10 show the raw data, 95th percentile data, and trendlines for single-precision GPU price / FLOPS for the Passmark dataset. This folder contains plots of all our datasets, including the Kaggle dataset and combined Passmark + Kaggle dataset.41
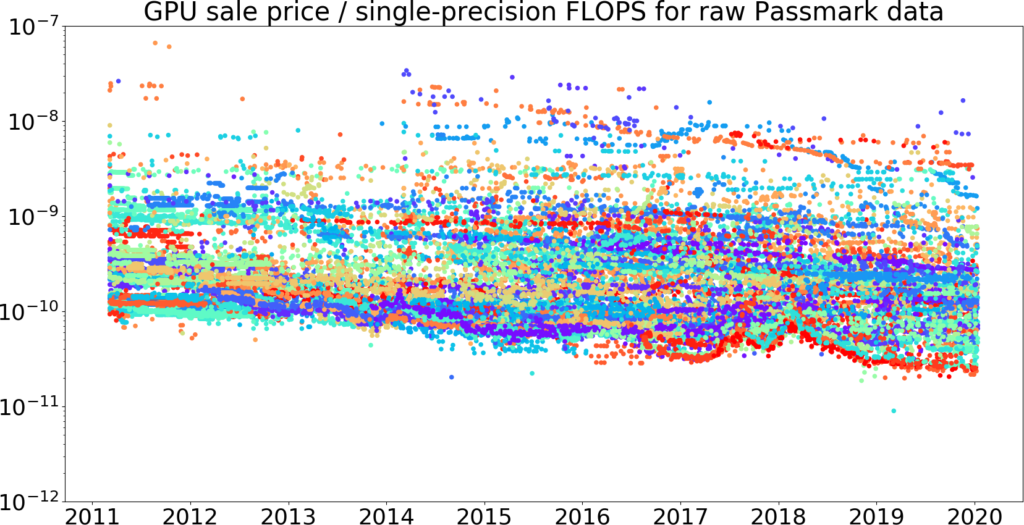
Figure 7: GPU price / single-precision FLOPS over time, taken from our Passmark dataset.42 Price is measured in 2019 dollars. This picture shows that the Kaggle data does appear to be a superset of the Passmark data from 2013 – 2018, giving us some evidence that the Passmark data is correct. The vertical axis is log-scale.
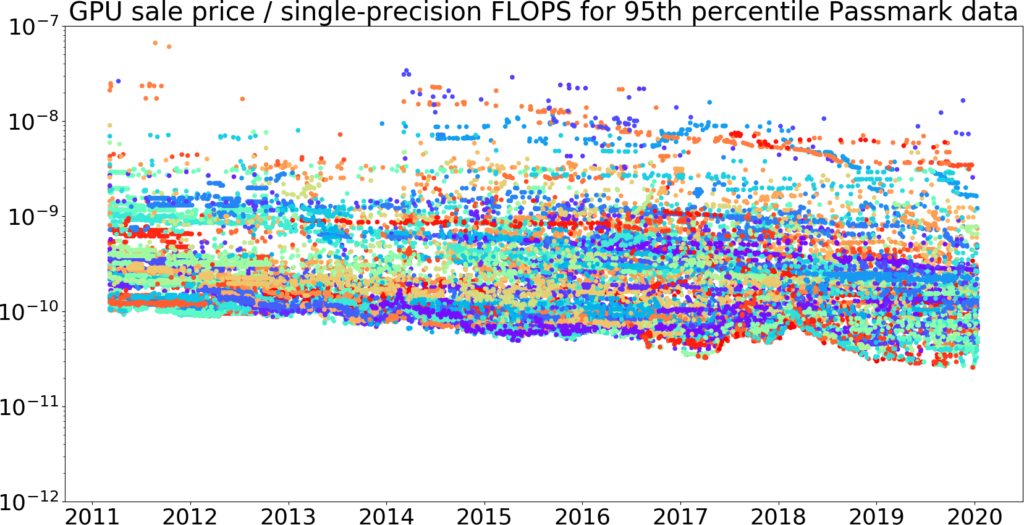
Figure 8: The top 95% of data every 10 days for GPU price / single-precision FLOPS over time, taken from the Passmark dataset we plotted above. (Figure 7 with the cheapest 5% removed.) The vertical axis is log-scale.43
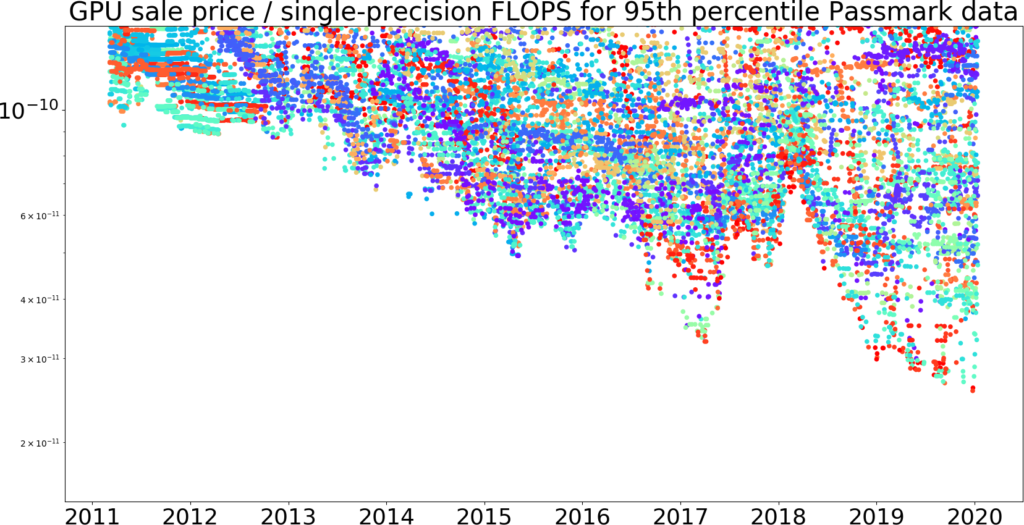
Figure 9: The same data as Figure 8, with the vertical axis zoomed-in.
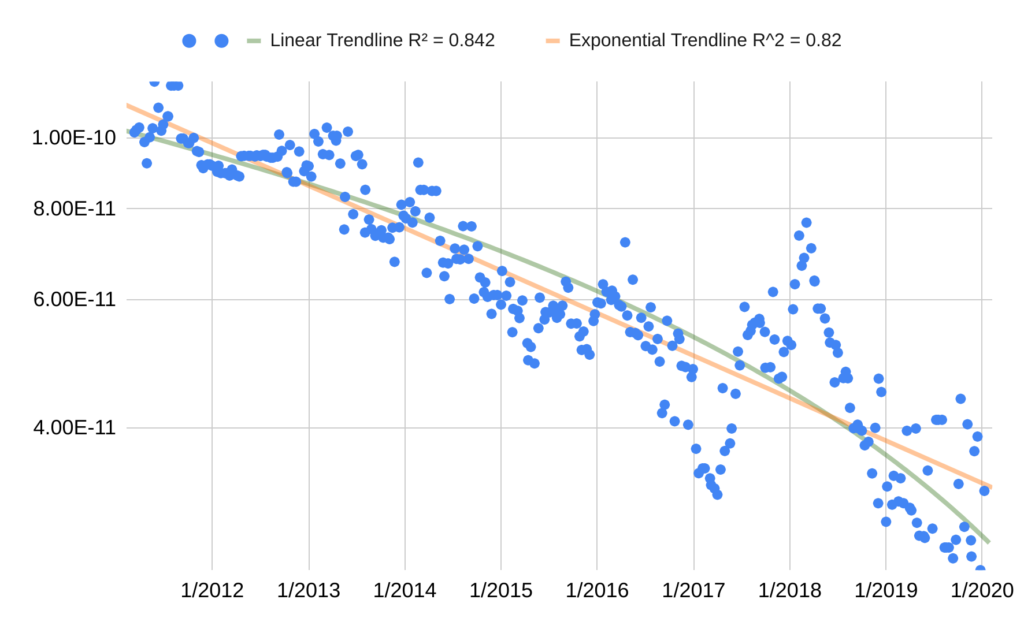
Analysis
The cheapest 95th percentile data every 10 days appears to fit relatively well to both a linear and exponential trendline. However we assume that progress will follow an exponential, because previous progress has followed an exponential.
In the Passmark dataset, the exponential trendline suggested that from 2011 to 2020, 95th-percentile GPU price / single-precision FLOPS fell by around 13% per year, for a factor of ten in ~17 years,45 bootstrap46 95% confidence interval 16.3 to 18.1 years.47 We believe the rise in price / FLOPS in 2017 corresponds to a rise in GPU prices due to increased demand from cryptocurrency miners.48 If we instead look at the trend from 2011 through 2016, before the cryptocurrency rise, we instead get that 95th-percentile GPU price / single-precision FLOPS price fell by around 13% per year, for a factor of ten in ~16 years.49
This is slower than the order of magnitude every ~12.5 years we found when looking at release prices. If we restrict the release price data to 2011 – 2019, we get an order of magnitude decrease every ~13.5 years instead,50 so part of the discrepancy can be explained because of the different start times of the datasets. To get some assurance that our active price data wasn’t erroneous, we spot checked the best active price at the start of 2011, which was somewhat lower than the best release price at the same time, and confirmed that its given price was consistent with surrounding pricing data.51 We think active prices are likely to be closer to the prices at which people actually bought GPUs, so we guess that ~17 years / order of magnitude decrease is a more accurate estimate of the trend we care about.
GPU price / half-precision FLOPS
Figures 11-14 show the raw data, 95th percentile data, and trendlines for half-precision GPU price / FLOPS for the Passmark dataset. This folder contains plots of the Kaggle dataset and combined Passmark + Kaggle dataset.
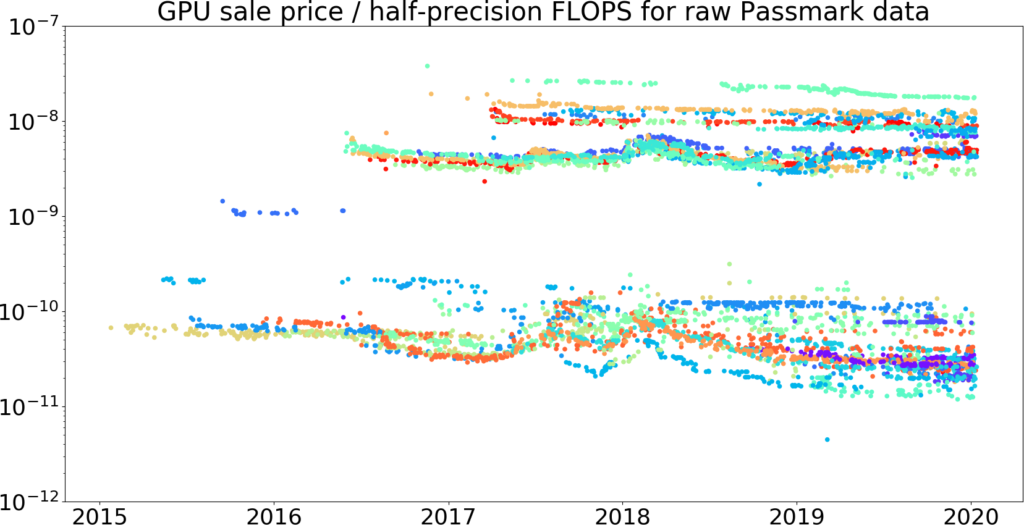
Figure 11: GPU price / half-precision FLOPS over time, taken from our Passmark dataset. Price is measured in 2019 dollars.52 This picture shows that the Kaggle data does appear to be a superset of the Passmark data from 2013 – 2018, giving us some evidence that the Passmark data is reasonable. The vertical axis is log-scale.
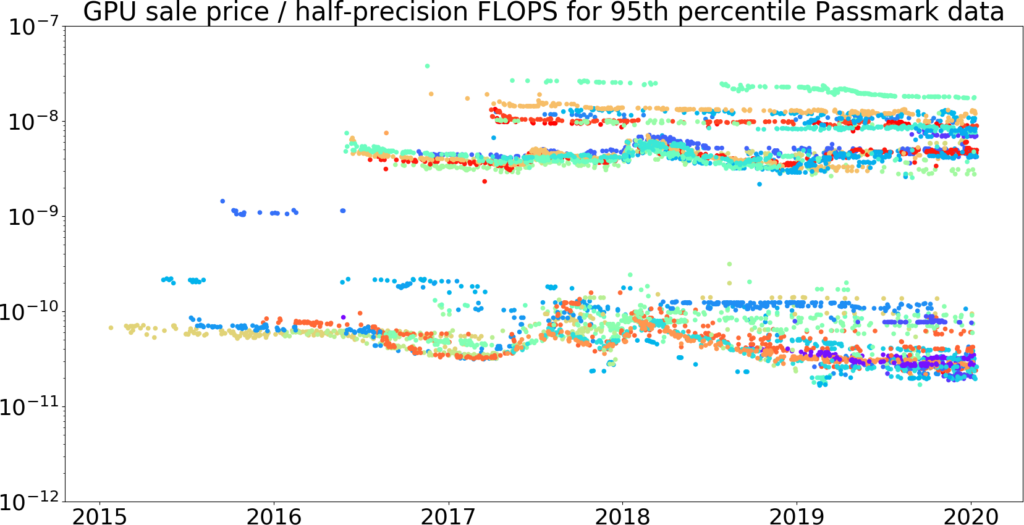
Figure 12: The top 95% of data every 30 days for GPU price / half-precision FLOPS over time, taken from the Passmark dataset we plotted above. (Figure 11 with the cheapest 5% removed.) The vertical axis is log-scale.53
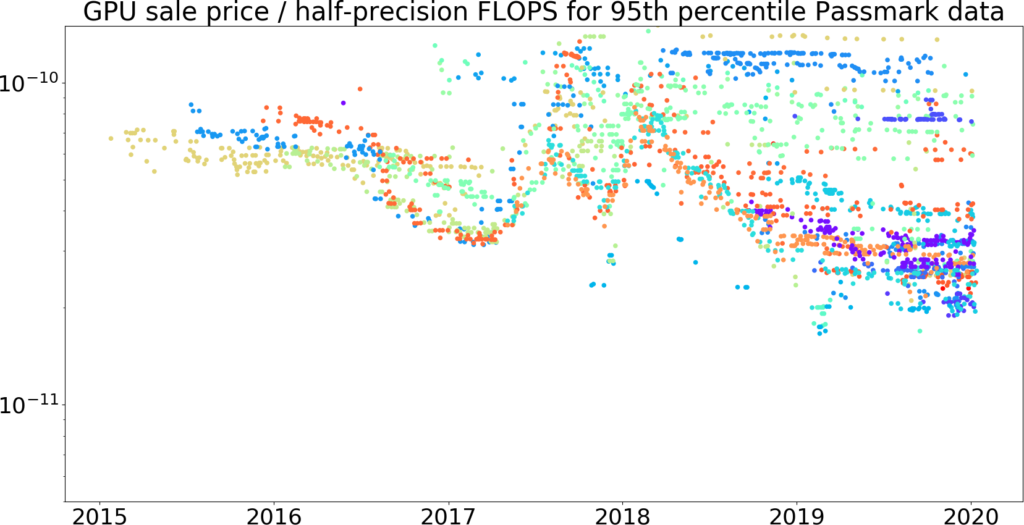
Figure 13: The same data as Figure 12, with the vertical axis zoomed-in.

Analysis
If we assume the trend is exponential, the Passmark trend seems to suggest that from 2015 to 2020, 95th-percentile GPU price / half-precision FLOPS of GPUs has fallen by around 21% per year, for a factor of ten over ~10 years,55 bootstrap56 95% confidence interval 8.8 to 11 years.57 This is fairly close to the ~8 years / order of magnitude decrease we found when looking at release price data, but we treat active prices as a more accurate estimate of the actual prices at which people bought GPUs. As in our previous dataset, there is a noticeable rise in 2017, which we think is due to GPU prices increasing as a result of cryptocurrency miners. If we look at the trend from 2015 through 2016, before this rise, we get that 95th-percentile GPU price / half-precision FLOPS has fallen by around 14% per year, which would yield a factor of ten over ~8 years.58
GPU price / half-precision FMA FLOPS
Figures 15-18 show the raw data, 95th percentile data, and trendlines for half-precision GPU price / FMA FLOPS for the Passmark dataset. GPUs with Tensor Cores are marked in black. This folder contains plots of the Kaggle dataset and combined Passmark + Kaggle dataset.
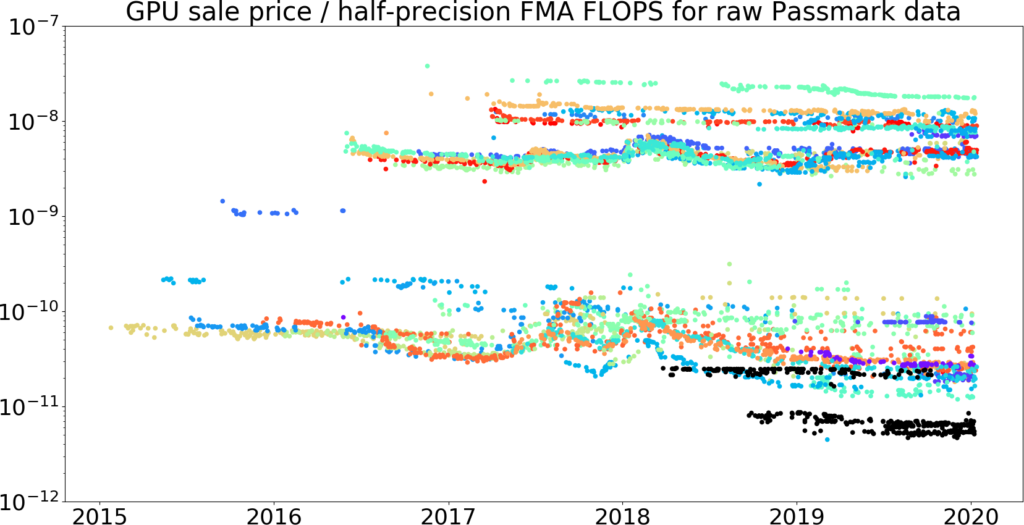
Figure 15: GPU price / half-precision FMA FLOPS over time, taken from our Passmark dataset.59 price is measured in 2019 dollars. This picture shows that the Kaggle data does appear to be a superset of the Passmark data from 2013 – 2018, giving us some evidence that the Passmark data is correct. The vertical axis is log-scale.
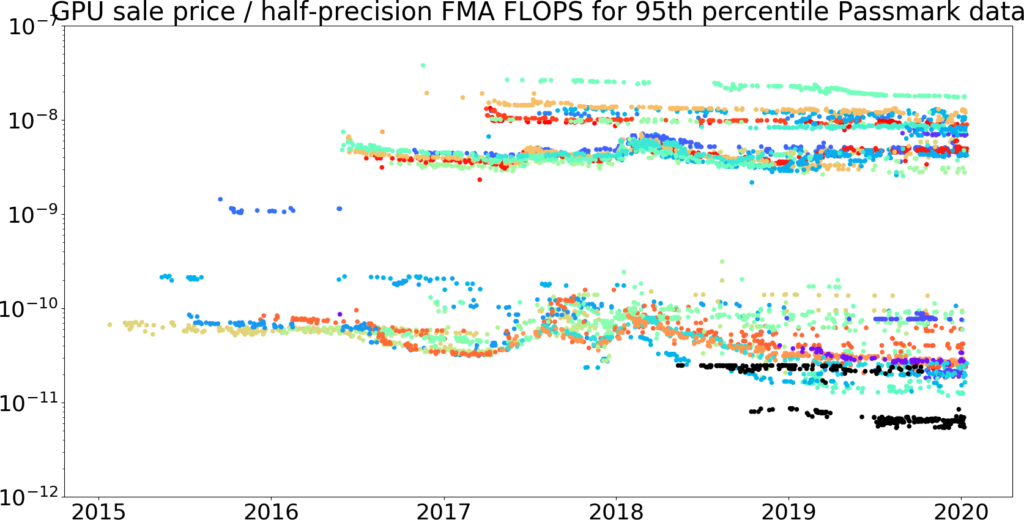
Figure 16: The top 95% of data every 30 days for GPU price / half-precision FMA FLOPS over time, taken from the Passmark dataset we plotted above.60 (Figure 15 with the cheapest 5% removed.)
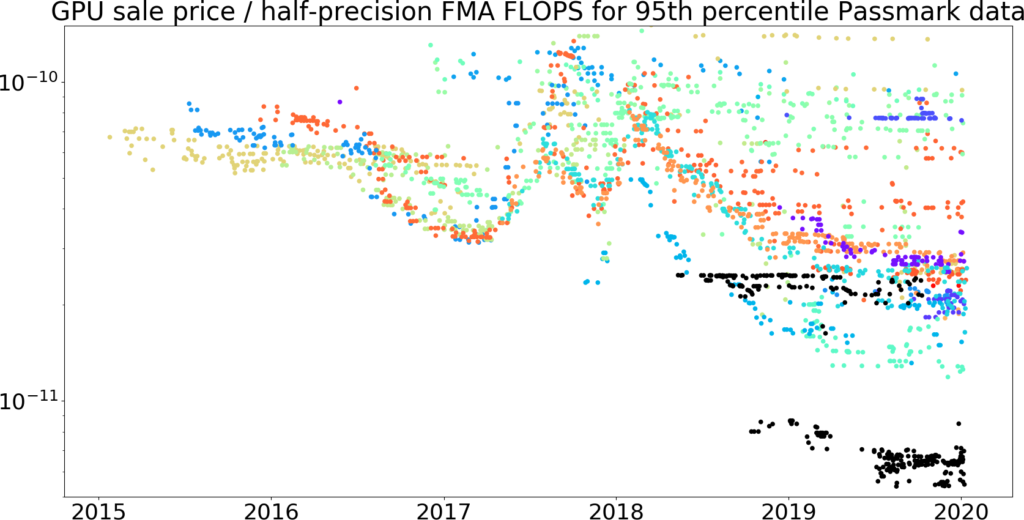
Figure 17: The same data as Figure 16, with the vertical axis zoomed-in.
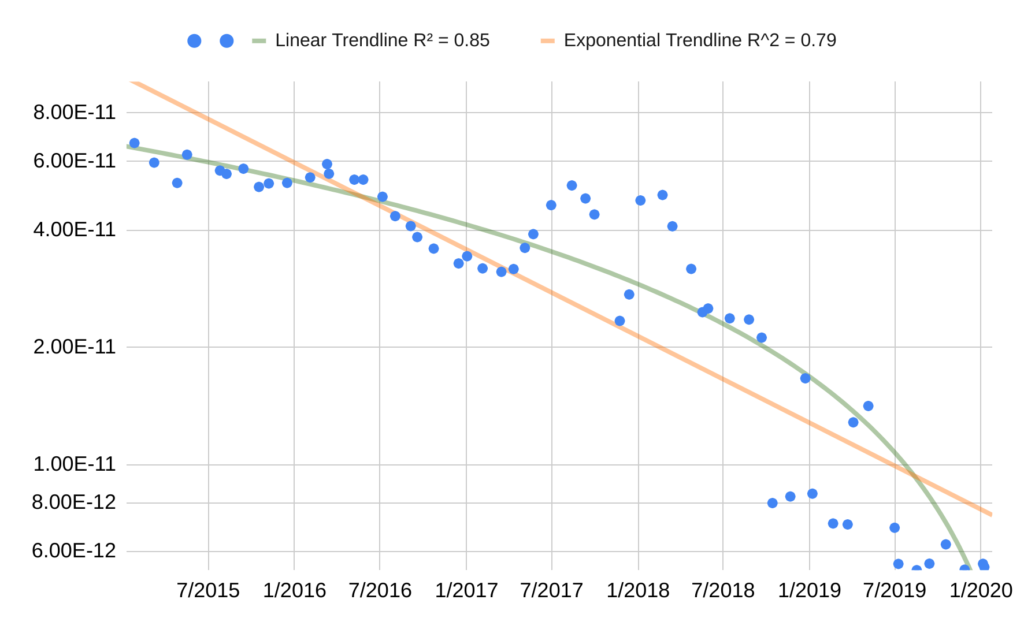
Analysis
If we assume the trend is exponential, the Passmark trend seems to suggest the 95th-percentile GPU price / half-precision FMA FLOPS of GPUs has fallen by around 40% per year, which would yield a factor of ten in ~4.5 years,62 with a bootstrap63 95% confidence interval 4 to 5.2 years.64 This is fairly close to the ~4 years / order of magnitude decrease we found when looking at release price data, but we think active prices are a more accurate estimate of the actual prices at which people bought GPUs.
The figures above suggest that certain GPUs with Tensor Cores were a significant (~half an order of magnitude) improvement over existing GPU price / half-precision FMA FLOPS.
Conclusion
We summarize our results in the table below.
| Release Prices | 95th-percentile Active Prices | 95th-percentile Active Prices (pre-crypto price rise) | |
| 11/2007 – 1/2020 | 3/2011 – 1/2020 | 3/2011 – 12/2016 | |
| $ / single-precision FLOPS | 12.5 | 17 | 16 |
| 9/2014 – 1/2020 | 1/2015 – 1/2020 | 1/2015 – 12/2016 | |
| $ / half-precision FLOPS | 8 | 10 | 8 |
| $ / half-precision FMA FLOPS | 4 | 4.5 | — |
Release price data seems to generally support the trends we found in active prices, with the notable exception of trends in GPU price / single-precision FLOPS, which cannot be explained solely by the different start dates.65 We think the best estimate of the overall trend for prices at which people recently bought GPUs is the 95th-percentile active price data from 2011 – 2020, since release price data does not account for existing GPUs becoming cheaper over time. The pre-crypto trends are similar to the overall trends, suggesting that the trends we are seeing are not anomalous due to cryptocurrency.
Given that, we guess that GPU prices as a whole have fallen at rates that would yield an order of magnitude over roughly:
- 17 years for single-precision FLOPS
- 10 years for half-precision FLOPS
- 5 years for half-precision fused multiply-add FLOPS
Half-precision FLOPS seem to have become cheaper substantially faster than single-precision in recent years. This may be a “catching up” effect as more of the space on GPUs was allocated to half-precision computing, rather than reflecting more fundamental technological progress.
Primary author: Asya Bergal
Notes
- “A graphics processing unit (GPU) is a specialized electronic circuit designed to rapidly manipulate and alter memory to accelerate the creation of images in a frame buffer intended for output to a display device … Modern GPUs are very efficient at manipulating computer graphics and image processing … The term was popularized by Nvidia in 1999, who marketed the GeForce 256 as “the world’s first GPU”. It was presented as a “single-chip processor with integrated transform, lighting, triangle setup/clipping, and rendering engines”.”
“Graphics Processing Unit.” Wikipedia. Wikimedia Foundation, March 24, 2020. https://en.wikipedia.org/w/index.php?title=Graphics_processing_unit&oldid=947270104. - Fraenkel, Bernard. “Council Post: For Machine Learning, It’s All About GPUs.” Forbes. Forbes Magazine, December 8, 2017. https://www.forbes.com/sites/forbestechcouncil/2017/12/01/for-machine-learning-its-all-about-gpus/#5ed90c227699.
- “In computing, floating point operations per second (FLOPS, flops or flop/s) is a measure of computer performance, useful in fields of scientific computations that require floating-point calculations. For such cases it is a more accurate measure than measuring instructions per second.”
“FLOPS.” Wikipedia. Wikimedia Foundation, March 24, 2020. https://en.wikipedia.org/w/index.php?title=FLOPS&oldid=947177339 - From this discussion on Nvidia’s forums about theoretical GFLOPS: “GPU theoretical flops calculation is similar conceptually. It will vary by GPU just as the CPU calculation varies by CPU architecture and model. To use K40m as an example: http://www.nvidia.com/content/PDF/kepler/Tesla-K40-PCIe-Passive-Board-Spec-BD-06902-001_v05.pdf
there are 15 SMs (2880/192), each with 64 DP ALUs that are capable of retiring one DP FMA instruction per cycle (== 2 DP Flops per cycle).
15 x 64 x 2 * 745MHz = 1.43 TFlops/sec
which is the stated perf:
http://www.nvidia.com/content/tesla/pdf/NVIDIA-Tesla-Kepler-Family-Datasheet.pdf “
Person. “Comparing CPU and GPU Theoretical GFLOPS.” NVIDIA Developer Forums, May 21, 2014. https://forums.developer.nvidia.com/t/comparing-cpu-and-gpu-theoretical-gflops/33335.
- From this blog post on the performance of TensorCores, a component of new Nvidia GPUs specialized for deep learning: “The problem is it’s totally unclear how to approach the peak performance of 120 TFLOPS, and as far as I know, no one could achieve so significant speedup on real tasks. Let me know if you aware of good cases.”
Sapunov, Grigory. “Hardware for Deep Learning. Part 3: GPU.” Medium. Intento, January 20, 2020. https://blog.inten.to/hardware-for-deep-learning-part-3-gpu-8906c1644664. - Gupta, Geetika. “Difference Between Single-, Double-, Multi-, Mixed-Precision: NVIDIA Blog.” The Official NVIDIA Blog, November 21, 2019. https://blogs.nvidia.com/blog/2019/11/15/whats-the-difference-between-single-double-multi-and-mixed-precision-computing/.
- See our 2017 analysis, footnote 4, which notes that single-precision price performance seems to be improving while double-precision price performance is not
- “With the growing importance of deep learning and energy-saving approximate computing, half precision floating point arithmetic (FP16) is fast gaining popularity. Nvidia’s recent Pascal architecture was the first GPU that offered FP16 support.”
N. Ho and W. Wong, “Exploiting half precision arithmetic in Nvidia GPUs,” 2017 IEEE High Performance Extreme Computing Conference (HPEC), Waltham, MA, 2017, pp. 1-7. - “In a recent paper, Google revealed that its TPU can be up to 30x faster than a GPU for inference (the TPU can’t do training of neural networks). As the main provider of chips for machine learning applications, Nvidia took some issue with that, arguing that some of its existing inference chips were already highly competitive to the TPU.”
Armasu, Lucian. “On Tensors, Tensorflow, And Nvidia’s Latest ‘Tensor Cores’.” Tom’s Hardware. Tom’s Hardware, May 11, 2017. https://www.tomshardware.com/news/nvidia-tensor-core-tesla-v100,34384.html. - “Volta is equipped with 640 Tensor Cores, each performing 64 floating-point fused-multiply-add (FMA) operations per clock. That delivers up to 125 TFLOPS for training and inference applications.”
“Tensor Cores in NVIDIA Volta GPU Architecture.” NVIDIA. Accessed March 25, 2020. https://www.nvidia.com/en-us/data-center/tensorcore/. - “A useful operation in computer linear algebra is multiply-add: calculating the sum of a value c with a product of other values a x b to produce c + a x b. Typically, thousands of such products may be summed in a single accumulator for a model such as ResNet-50, with many millions of independent accumulations when running a model in deployment, and quadrillions of these for training models.”
Johnson, Jeff. “Making Floating Point Math Highly Efficient for AI Hardware.” Facebook AI Blog, November 8, 2018. https://ai.facebook.com/blog/making-floating-point-math-highly-efficient-for-ai-hardware/. - See Figure 2:
Gupta, Geetika. “Using Tensor Cores for Mixed-Precision Scientific Computing.” NVIDIA Developer Blog, April 19, 2019. https://devblogs.nvidia.com/tensor-cores-mixed-precision-scientific-computing/. - See the ‘Source’ column in this spreadsheet, tab ‘GPU Data’. We largely used TechPowerUp, Wikipedia’s List of Nvidia GPUs, List of AMD GPUs, and this document listing GPU performance.
- See this spreadsheet, tab ‘Cleaned GPU Data for SP’ for the chart generation.
- See this spreadsheet, tab ‘Cleaned GPU Data for SP Minimums’ for the plotting. We used this script on the data from the ‘Cleaned GPU Data for SP’ to calculate the minimums and then import them into a new sheet of the spreadsheet.
- See this spreadsheet, tab ‘Cleaned GPU Data for SP Minimums’ for the calculation.
- See this spreadsheet, tab ‘Cleaned GPU Data for HP’ for the chart generation.
- See this spreadsheet, tab ‘Cleaned GPU Data for HP Minimums’ for the plotting. We used this script on the data from the ‘Cleaned GPU Data for HP’ to calculate the minimums and then import them into a new sheet of the spreadsheet.
- See this spreadsheet, tab ‘Cleaned GPU Data for HP Minimums’ for the calculation.
- See this spreadsheet, tab ‘Cleaned GPU Data for HP + Tensor Cores’ for the chart generation.
- See this spreadsheet, tab ‘Cleaned GPU Data for HP + Tensor Cores Minimums’ for the plotting. We used this script on the data from the ‘Cleaned GPU Data for HP + Tensor Cores’ to calculate the minimums and then import them into a new sheet of the spreadsheet.
- See this spreadsheet, tab ‘Cleaned GPU Data for HP + Tensor Cores Minimums’ for the calculation.
- For example, one of the GPUs recommended for deep learning in this Reddit thread is the GTX 1060 (6GB), which has been around since 2016.
- We scraped data from individual TechPowerUp pages using this script. Our full scraped TechPowerUp dataset can be found here.
- We chose to automatically scrape theoretical peak performance numbers from TechPowerUp instead of using the ones we manually collected above because there were several GPUs in the active pricing datasets that we hadn’t collected data for manually, and it was easier to scrape the entire site than just the subset of GPUs we needed.
- We used this script.
- “PassMark – GeForce GTX 660 – Price Performance Comparison.” Accessed March 24, 2020. https://www.videocardbenchmark.net/gpu.php?gpu=GeForce+GTX+660&id=2152.
- In most cases where renaming was necessary, the same GPU had multiple clear names, e.g. the “Radeon HD 7970 / R9 280X” in PassMark was just called the “Radeon HD 7970” in TechPowerUp. In a few cases, Passmark listed some GPUs which TechPowerUp listed separately as one GPU, e.g. “Radeon R9 290X / 390X” seemed to ambiguously refer to the Radeon R9 290X or Radeon R9 390X. In these cases, we conservatively assume that the GPU refers to the less powerful / earlier GPU. In one exceptional case, we assumed that the “Radeon R9 Fury + Fury X” referred to the Radeon Fury X in PassMark. The ambiguously named GPUs were not in the minimum data we calculated, so probably did not have a strong effect on the final result.
- See this plot of Passmark single-precision GPU price / FLOPS compared to the combined Passmark and Kaggle single-precision GPU price / FLOPS, and this plot of Passmark half-precision GPU price / FLOPS compared to the combined Passmark and Kaggle half-precision $ / FLOPS. In both cases the 2013 – 2018 Passmark data appears to roughly be a subset of the Kaggle data.
- This calculation can be found in this spreadsheet.
- We used a Python plotting library to generate our plots, the script can be found here. All of our resulting plots can be found here. ‘single’ vs. ‘half’ refers to whether its $ / FLOPS data for single or half-precision FLOPS, ‘passmark’, ‘kaggle’, and ‘combined’ refer to which dataset is being plotted and ‘raw’ vs. ‘95’ refer to whether we’re plotting all the data or the 95th percentile data.
- The script to calculate the 95th percentile and generate this plot can be found here.
- See here, tab ‘Passmark SP Minimums’ to see our calculation of the minimums over time. We used this script to generate the minimums, then imported them into this spreadsheet.
- You can see our calculations for this here, sheet ‘Passmark SP Minimums’. Each sheet has a cell ‘Rate to move an order of magnitude’ which has our calculation for how many years we need to move an order of magnitude. In the (untrustworthy) Kaggle dataset alone, its rate would yield an order of magnitude of decrease every ~12 years, and the rate in the combined dataset would yield an order of magnitude of decrease every ~16 years.
- Orloff, Jeremy, and Jonathan Bloom. “Bootstrap Confidence Intervals.” MIT OpenCourseWare, 2014. https://ocw.mit.edu/courses/mathematics/18-05-introduction-to-probability-and-statistics-spring-2014/readings/MIT18_05S14_Reading24.pdf.
- We used this script to generate bootstrap confidence intervals for our datasets.
- We think this is the case because we’ve observed this dip in other GPU analyses we’ve done, and because the timing lines up: the first table in this article shows how GPU prices were increasing starting 2017 and continued to increase through 2018, and the chart here shows how GPU prices increased in 2017.
- You can see our calculations for this here, sheet ‘Passmark SP Minimums’, next to ‘Exponential trendline from 2015 to 2016. The trendline calculated is technically the linear fit through the log of the data.
- See our calculation here, tab ‘Cleaned GPU Data for SP Minimums’, next to the cell marked “Exponential trendline from 2011 to 2019.”
- At the start of 2011, the minimum release price / FLOPS (see tab, ‘Cleaned GPU Data for SP Minimums’) is .000135 $ / FLOPS, whereas the minimum active price / FLOPS (see tab, ‘Passmark SP Minimums’) is around .0001 $ / FLOPS. The initial GPU price / FLOPS minimum (see sheet ‘Passmark SP Minimums’) corresponds to the Radeon HD 5850 which had a price of $184.9 in 3/2011 and a release price of $259. Looking at the general trend in Passmark suggests that the Radeon HD 5850 did indeed rapidly decline from its $259 release price to consistently below $200 prices.
- See here, tab ‘Passmark HP Minimums’ to see our calculation of the minimums over time. We used this script to generate the minimums, then imported them into this spreadsheet.
- See the sheet marked ‘Passmark HP minimums’ in this spreadsheet. The trendline calculated is technically the linear fit through the log of the data.
- Orloff, Jeremy, and Jonathan Bloom. “Bootstrap Confidence Intervals.” MIT OpenCourseWare, 2014. https://ocw.mit.edu/courses/mathematics/18-05-introduction-to-probability-and-statistics-spring-2014/readings/MIT18_05S14_Reading24.pdf.
- We used this script to generate bootstrap confidence intervals for our datasets.
- See the sheet marked ‘Passmark HP minimums’ in this spreadsheet.
- See here, tab ‘Passmark HP FMA Minimums’ to see our calculation of the minimums over time. We used this script to generate the minimums, then imported them into this spreadsheet.
- See the sheet marked ‘Passmark HP FMA minimums’ in this spreadsheet. The trendline calculated is technically the linear fit through the log of the data.
- Orloff, Jeremy, and Jonathan Bloom. “Bootstrap Confidence Intervals.” MIT OpenCourseWare, 2014. https://ocw.mit.edu/courses/mathematics/18-05-introduction-to-probability-and-statistics-spring-2014/readings/MIT18_05S14_Reading24.pdf.
- We used this script to generate bootstrap confidence intervals for our datasets.
- See our analysis in this section above.

