Table of Contents
Historic trends in bridge span length
Published 07 February, 2020
We measure eight discontinuities of over ten years in the history of longest bridge spans, four of them of over one hundred years, five of them robust as to slight changes in trend extrapolation.
The annual average increase in bridge span length increased by over a factor of one hundred between the period before 1826 and the period after (0.25 feet/year to 35 feet/year), though there was not a clear turning point in it.
Details
This case study is part of AI Impacts’ discontinuous progress investigation.
Background
A bridge span is a section of bridge between supports.1 Bridges can have multiple spans, e.g. one for each arch.2 Bridges are often measured by their ‘main span’.
We investigated bridge span (rather than bridge length, mass, or carrying capacity) because it was suggested to us as discontinuous. We also expect it to be a good metric for seeing technological progress, rather than economic progress, because additional spending can probably add more spans to a structure more easily than it can make each span longer. Span length is also a less ambiguous metric than total length, since it is not always clear where a road ends and a bridge begins.
Trends
Longest bridge span length
Data
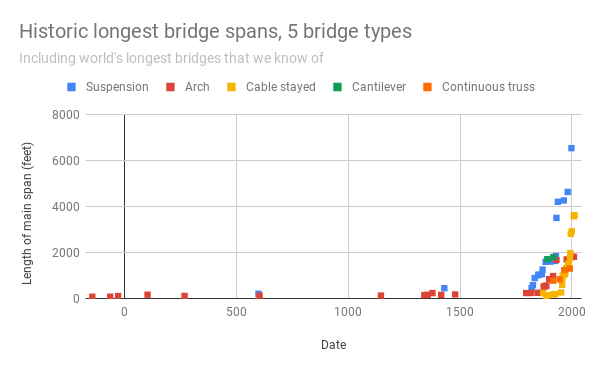
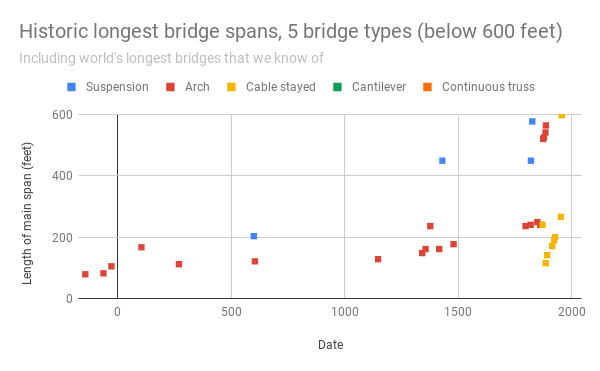
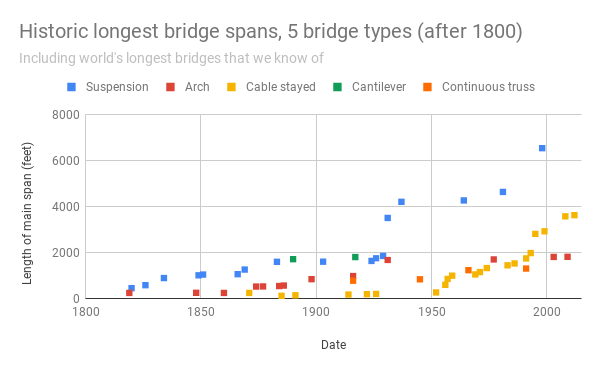
We gathered data for bridge span lengths from several Wikipedia lists of longest bridge spans over history for particular types of bridge, plus a few additional datapoints from elsewhere. Our data and citations are in this spreadsheet in the tab ‘five bridge types’.
Problems, ambiguities, and limitations of the data and our collection process:
- Some span lengths are given as different lengths on different Wikipedia pages. We did not investigate this, and the one we used was arbitrary.
- We did not find a list of historic longest bridge spans for all bridge types, so used several pages about longest bridges for particular bridge types, for instance List of Longest Suspension Bridge Spans. It is quite possible we failed to find all such lists. In the data we have though, suspension bridges are usually longer than anything else, and the Wikipedia History of Longest Suspension Bridge Spans mentions in its list a few times when non-suspension bridges are the longest bridge span in the world, suggesting that the authors of that page at least believe that at all other times the suspension bridges are the longest. We had already found the other bridges they mention (all arch or cantilever bridges).
- We have not investigated the accuracy of the Wikipedia data.
- We are unsure what exact definition of ‘bridge’ is used in any of these pages. Our impression is that they need to allow foot vehicle traffic to cross independently (e.g. it looks like foot bridges are included, but not this cable car with a 2831m span, which it seems would hold the current record were it a bridge). We have not investigated more.
- We treated dates of N BC dates -N
Figure 1-3 show the length of the longest bridge span for five types of bridge over time. If we understand correctly, these include the longest bridges of any kind at least since around 500AD.


Discontinuity measurement
To measure discontinuities relative to past progress, we treat past progress as linear, and belonging to five different periods (i.e. three times we consider the recent trend to be sufficiently different from the older trend that we base our extrapolation on a new period).4
Using this method, the length of the longest bridge span has seen a large number of discontinuities (see table below).
| Name | Year opened/became longest of type | Main span (feet) | Discontinuity |
| Chakzam Bridge* | 1430 | 449 | 2230 |
| Menai Suspension Bridge | 1826 | 577 | 146 |
| Great Suspension Bridge* | 1834 | 889 | 403 |
| Wheeling Suspension Bridge | 1849 | 1010 | 70 |
| Niagara Clifton Bridge* | 1869 | 1260 | 14 |
| George Washington Bridge* | 1931 | 3501 | 132 |
| Golden Gate Bridge | 1937 | 4200 | 19 |
| Akashi-Kaikyo Bridge* | 1998 | 6532 | 56 |
| *Entry was more robust to informal experimentation with different linear extrapolations |
Deciding what to treat as the previous trend at any point is hard in this dataset, because the shape of the trend isn’t close to being exponential or linear. The sizes of the discontinuities and even the particular bridges that count as notably discontinuous are not very robust to different choices. In a small amount of experimentation with different linear trends, five bridges were always discontinuities, marked with * in the above table. That the overall trend is marked by many discontinuities seems robust.
In addition to the size of these discontinuity in years, we have tabulated a number of other potentially relevant metrics here.5
Change in rate of progress
The annual average increase in bridge span length increased by over a factor of one hundred between the period before 1826 and the period after (0.25 feet/year to 35 feet/year), though there was not a clear turning point in it. See spreadsheet for calculation (tab: ‘Five bridge types (longest)’)
Notes
- Span is the distance between two intermediate supports for a structure, e.g. a beam or a bridge.
“Span (Engineering).” In Wikipedia, November 7, 2017. https://en.wikipedia.org/w/index.php?title=Span_(engineering)&oldid=809190532.
- From Wikimedia Commons. The original uploader was Sam at English Wikipedia. [CC BY-SA 3.0 (http://creativecommons.org/licenses/by-sa/3.0/)]
- See our methodology page for details on how we divide the data into trends and how to interpret the spreadsheet.
- See our methodology page for more details.

