Table of Contents
Examples of Progress for a Particular Technology Stopping
Published 01 August, 2023; last updated 01 August, 2023
Trends in performance on technological metrics frequently plateau after decades of progress. Plateaus frequently last for decades.
Details
Data
The examples of trends in performance for a particular technological metric shown here are taken from Patterns of Technological Innovation1) and our discontinuous progress investigation.
We have not done any statistical analysis and instead looked for visible changes in the data series.
Eleven data series are shown below. They contain 23 periods of progress which range from 5 to 78 years (average 20 years) and 18 plateaus which range from 5 to 53 years (average 21 years). A table of periods of progress and plateaus can be seen here.
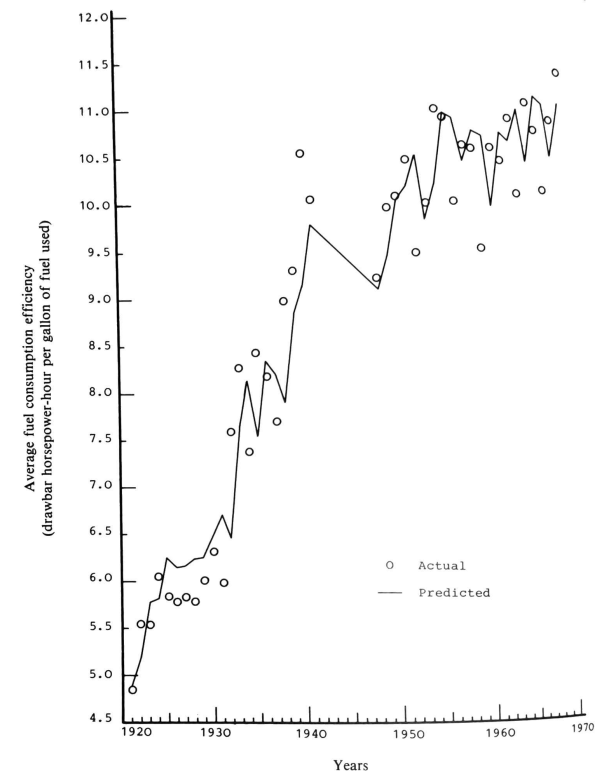
Average Fuel-Consumption Efficiency of Farm Tractors
Figure 6.3 in Patterns of Technological Innovation is a 50 year time series, from 1920-1970.2) Progress stops once, in 1940, and remains stopped for the rest of the time series or 30 years.
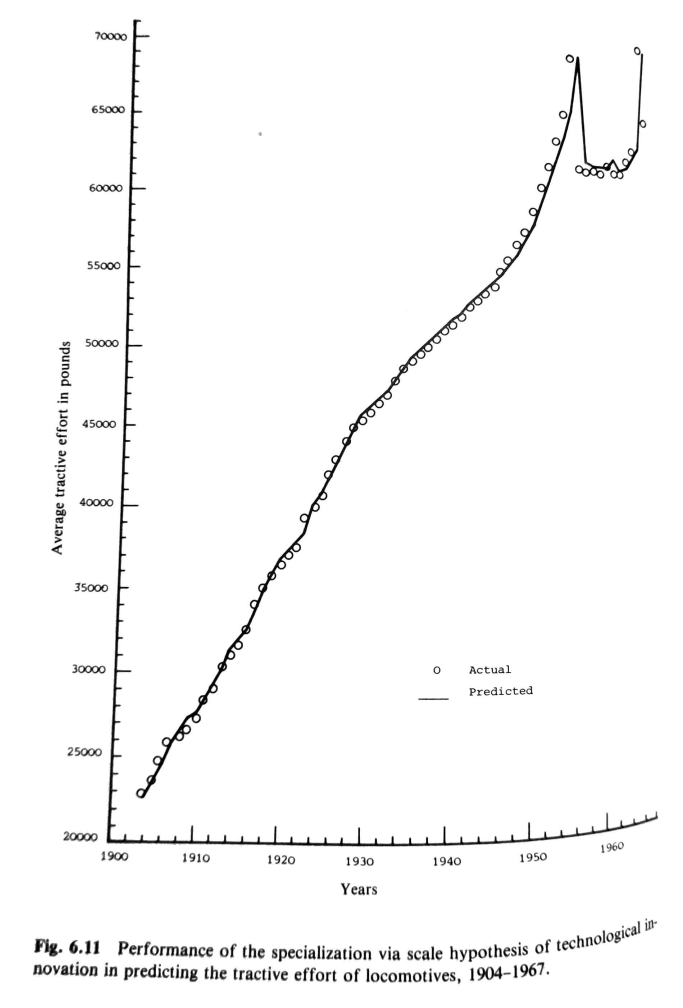
Average Tractive Effort of Locomotives
Figure 6.11 in Patterns of Technological Innovation is a 64 year time series, from 1904-1967. Progress stops once, in 1955, and remains stopped for 10 years.
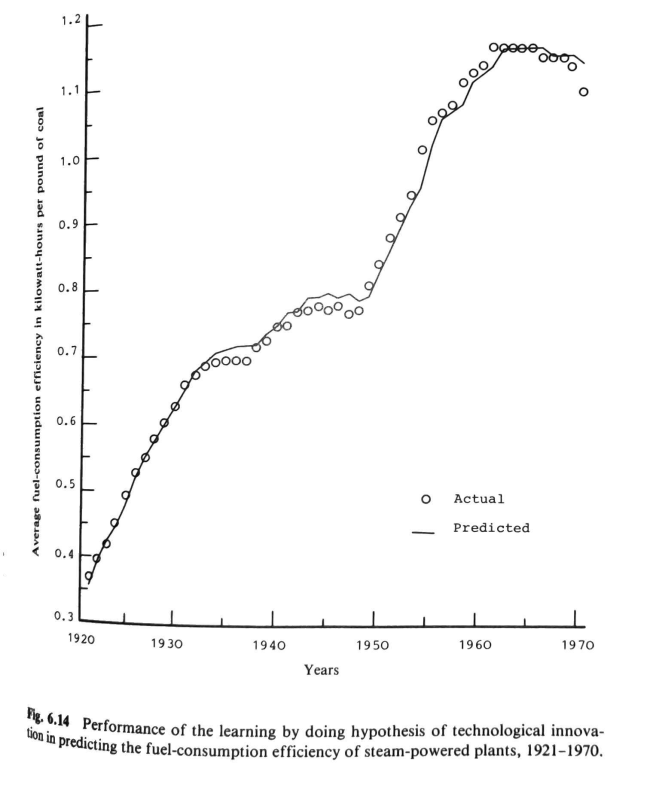
Average Efficiency of Steam-Powered Plants
Figure 6.14 in Patterns of Technological Innovation is a 50 year time series, from 1920-1970. Progress stops in 1933 for 5 years, in 1943 for 5 years, and in 1960 for the rest of the time series or 10 years.
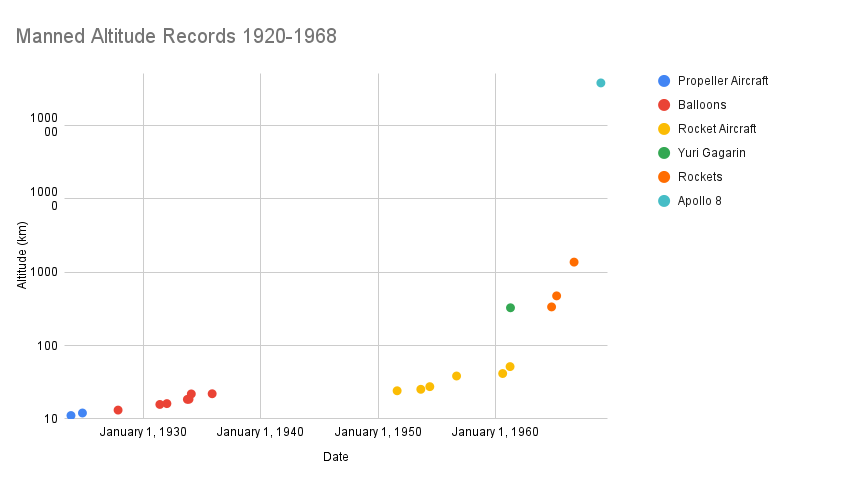
Record Manned Altitude
Historic trends in manned altitude includes a 48 year data series, from 1920-1968. Progress stops once, in 1935, and remains stopped for 16 years. Although not shown on this graph, this data series can be extended to today, for a total of 104 years. Progress stops a second time, in 1970, and has remains stopped since, for 53 years.
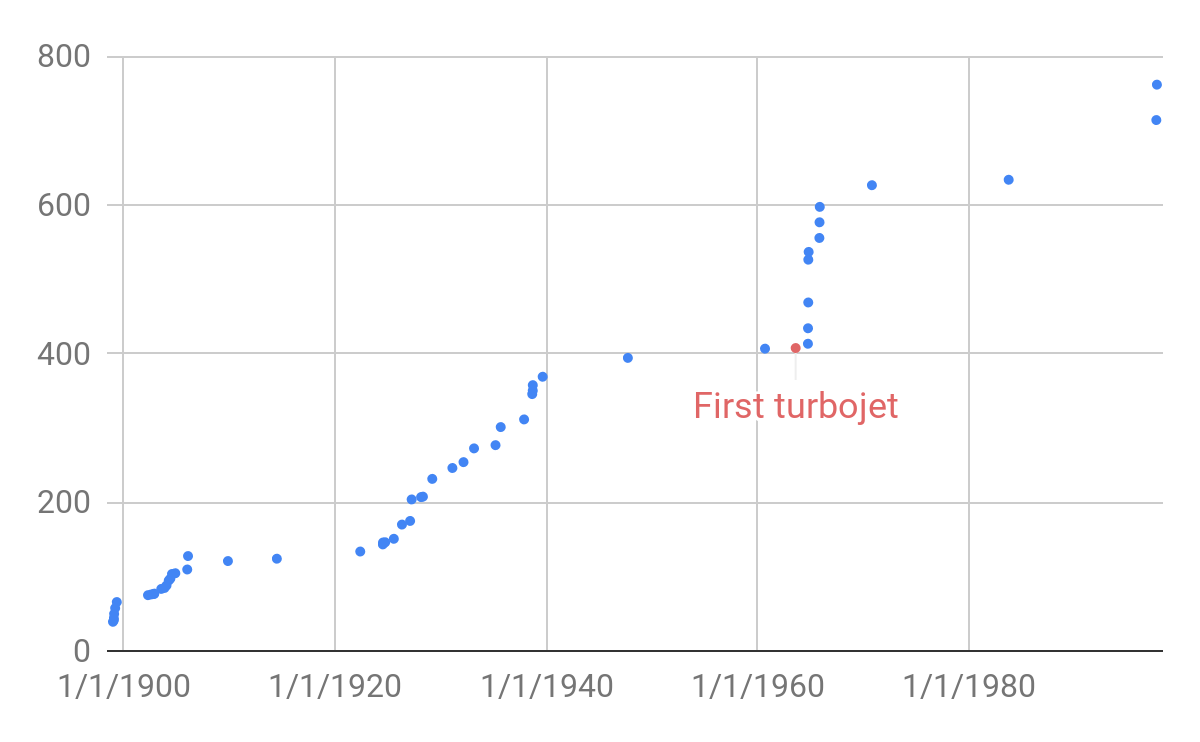
Record Land Speed
Historic trends in land speed records includes a 100 year data series, from 1898-1997. Progress plateaued in 1909 for 12 years, in 1939 for 24 years, and in 1970 for 27 years.
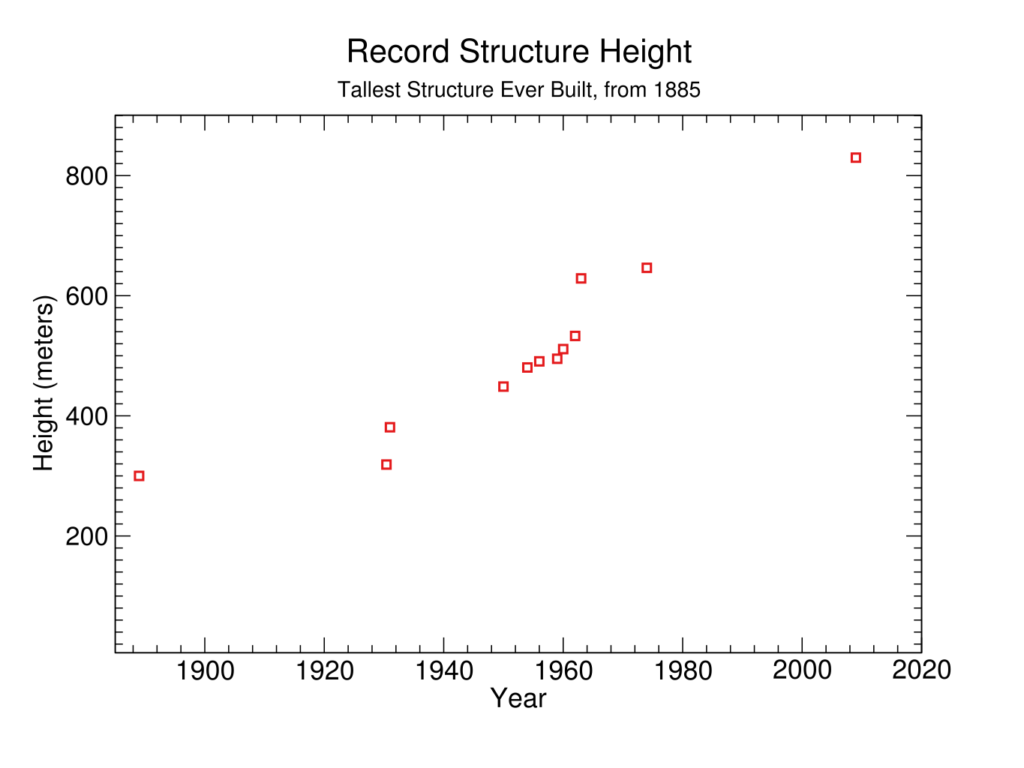
Record Structure Height
Historic trends in structure heights includes a 145 year data series, from 1885 to 2020. The earlier data points are sparse and do not have a clear trend. Starting where the trend begins in 1950, the data series extends over 70 years and has one plateau starting in 1963 which lasts for 46 years.
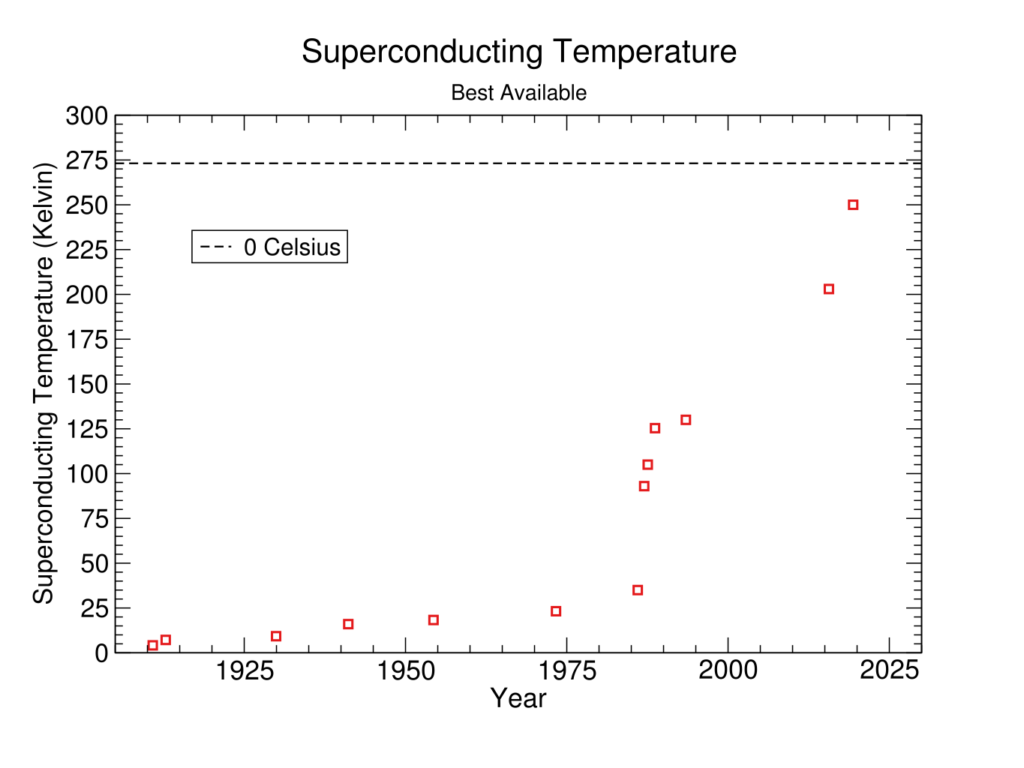
Record Superconducting Temperature
Historic trends in the maximum superconducting temperature includes a 110 year data series, from 1910 to 2020. There is one plateau starting in 1988 which lasts for 27 years.
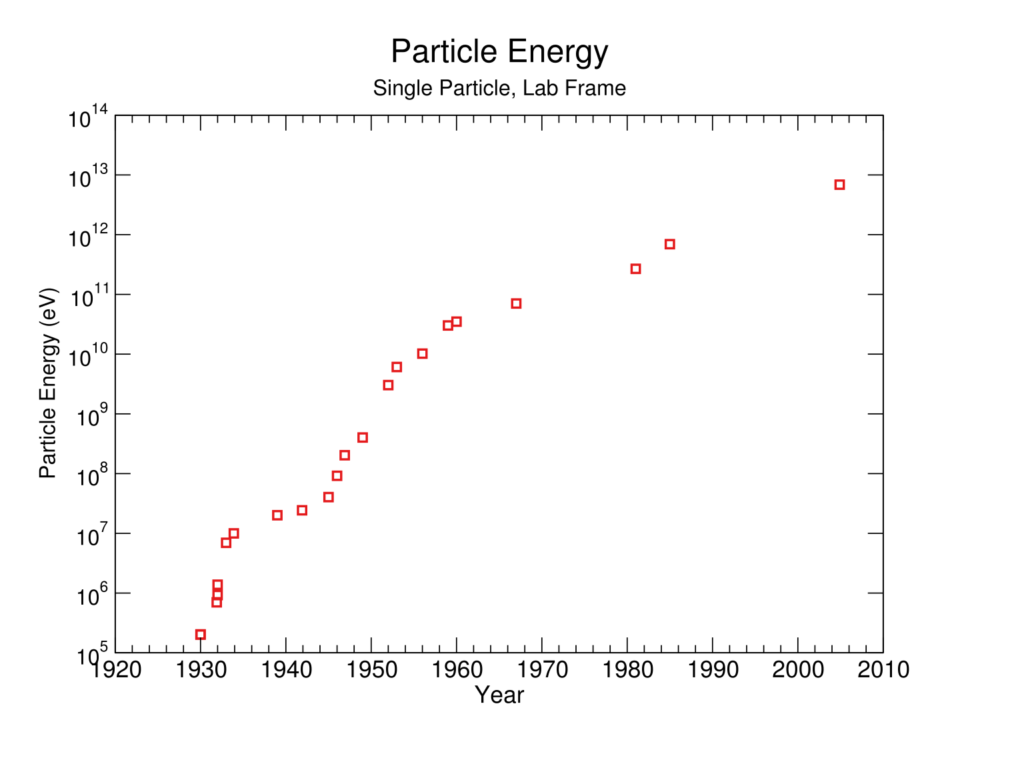
Record Particle Accelerator Energy
Historic trends in particle accelerator performance includes an 80 year data series from 1930 to 2010. Progress does not stop at any point, but it does slow significantly in 1935 for 5 years and in 1960 for 20 years.
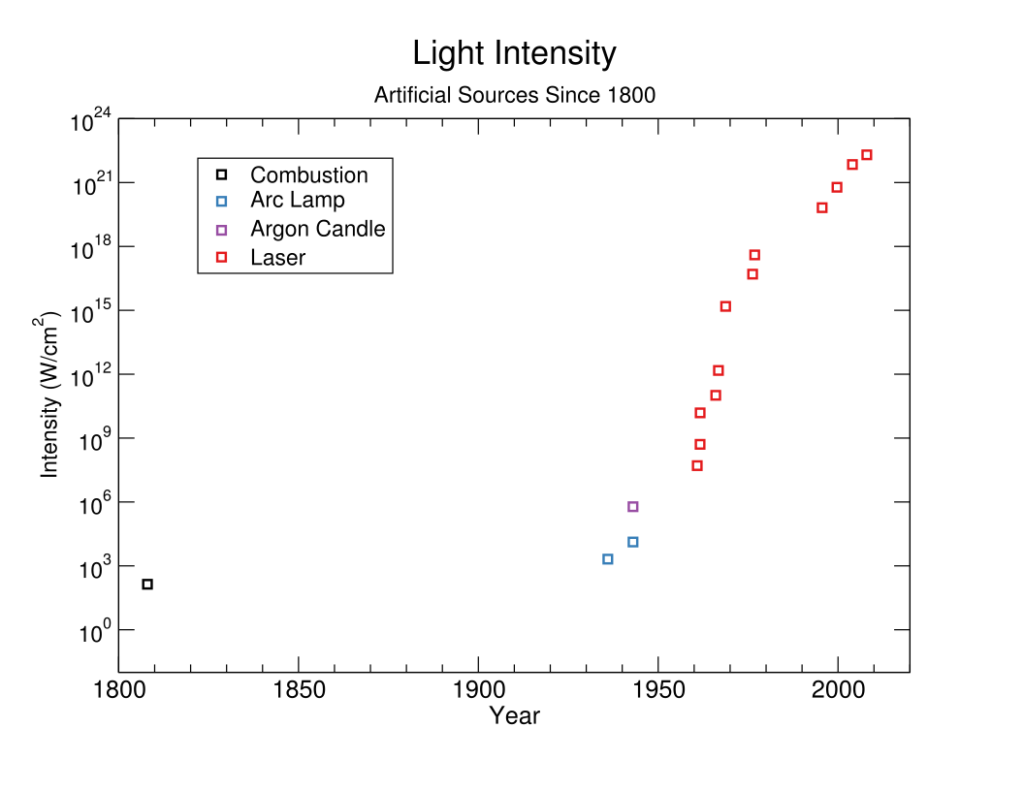
Record Light Intensity
Historic trends in light intensity includes a 210 year data series from 1800 to 2010. There are also records on the page from before 1800. The earlier data points are sparse and do not have a clear trend. Starting where the trend begins in 1936, there is a 74 year data series which has two plateaus in 1943 for 17 years and in 1976 for 19 years.
The plateau in 1976 is particularly dramatic. Lasers were a new technology which had increased the maximum artificial light intensity by ten orders of magnitude over the previous 16 years, before progress stopped for 19 years.
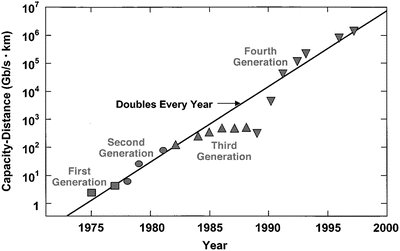
Record Bandwidth-Distance Product for Fiber Optic Cables
Historic trends in telecommunications performance includes a 25 year time series from 1975-2000.3) Progress stops in 1985 and remains stopped for 5 years.
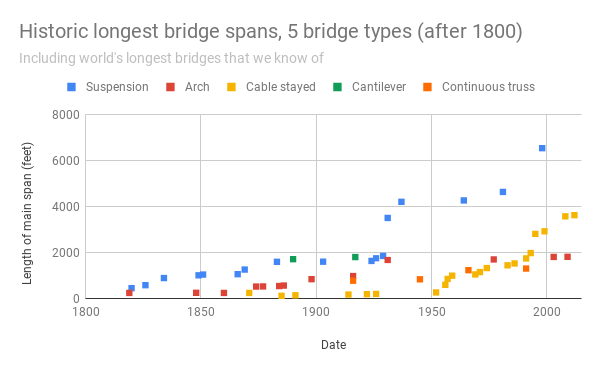
Record Bridge Span Length
Historic trends in bridge span length includes a 220 year data series, from 1800 to 2020. Starting in the year 1900, after which the data is more likely to be complete, the data series lasts for 120 years. Progress plateaus once in 1937 for 45 years.
Possible Explanations
Here are some factors that might contribute to plateaus in progress:
- There is some fundamental physical limit, like the Carnot efficiency or a single atom transistor.
- Technological development often follows ‘technological guideposts’,4) a basic design which has a few essential aspects which remain unchanged, to which incremental progress adds a great many innovations. Progress stops when the best possible version of a particular technological guidepost is achieved, then restarts with the introduction of a new technological guidepost.
- Limits to the scale of the system the technology is deployed in.
- Changes in the cost of the different factors of production could decrease or increase the incentive for improving a technology in a particular way. For example, falling fuel prices could reduce the incentive to make more fuel efficient tractors.
- Reallocations of research and development effort. Several of these data series have plateaus during WWII, which caused large changes in research priorities.
- Regulations or other forms of governance.
It does not seem to be uncommon for a particular technology to have both periods of progress and stagnation.
Primary author: Jeffrey Heninger
Notes
